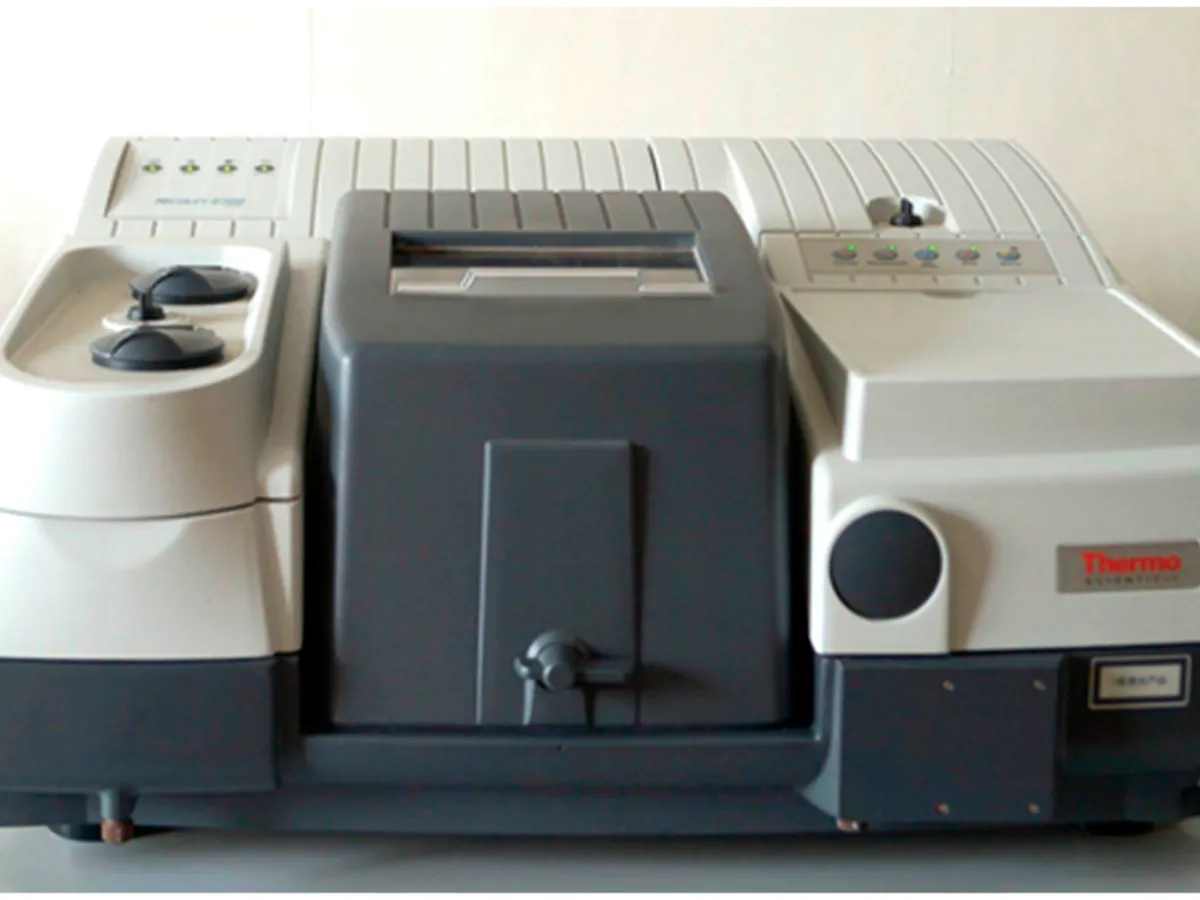
Fourier Transform Infrared (FTIR) Spectrometer
Records the infrared absorption spectrum of a sample, which acts as a molecular fingerprint. The standard technique for identification of APIs and excipients in pharma QC.
- Pharmaceutical
- Polymers & plastics
- Chemicals
- Forensics
- Food
- Academic research
What is FTIR?
Every molecule vibrates: its bonds stretch and bend at particular frequencies. When infrared light at the same frequency hits the molecule, it is absorbed. An FTIR spectrometer measures which frequencies (reported as wavenumbers, in cm⁻¹) are absorbed and how strongly, across the mid-infrared range of roughly 4000 to 400 cm⁻¹.
The result is a spectrum with many bands. The region above about 1500 cm⁻¹ shows characteristic functional groups (O–H, N–H, C=O, C–H), while the region below it, the fingerprint region, has a pattern so specific that two different compounds almost never give the same spectrum. This is why IR is the first-choice identification test in most pharmacopoeial monographs.
Modern instruments use an interferometer and a mathematical Fourier transform instead of scanning wavelength by wavelength, so a full spectrum takes a few seconds. With an attenuated total reflectance (ATR) accessory, most solids and liquids can be measured directly with no sample preparation.
Used for
- Identification of APIs, excipients and solvents on receipt
- Identification of packaging materials (polymer films, bottles, stoppers)
- Detection of polymorphic forms where the spectra differ
- Investigation of unknown contaminants and foreign particles
- Counterfeit and adulteration screening
- Monitoring of reactions and functional groups in development
How it works
- 01
IR source
A heated ceramic or silicon carbide element (globar) emits broadband mid-infrared light.
- 02
Interferometer
A beam splitter sends light to a fixed and a moving mirror; the recombined beams interfere, producing an interferogram that encodes every wavenumber at once.
- 03
Sample
The modulated beam passes through a KBr disc or reflects off an ATR crystal in contact with the sample.
- 04
Detector
A DTGS (room temperature) or MCT (liquid-nitrogen cooled) detector records the interferogram.
- 05
Fourier transform
The software converts the interferogram into a single-beam spectrum and ratios it against the background.
- 06
Spectrum and comparison
The final transmittance or absorbance spectrum is compared with a reference standard spectrum or library.
Advantages
- Highly specific: the fingerprint region identifies a compound almost uniquely
- Fast: a full spectrum in seconds
- Little or no sample preparation with ATR
- Works for solids, liquids, pastes and films
- Fourier transform gives high signal-to-noise and accurate wavenumbers (internal laser reference)
Limitations
- Mainly qualitative in routine QC; quantitative work needs careful validation
- Water and carbon dioxide absorb strongly and can interfere
- Different polymorphs, hydrates or salts can give different spectra, which may need sample treatment before comparison
- Mixtures give overlapping spectra that are hard to interpret
- KBr discs need skill and dry conditions to prepare well
3 calibration procedures
Methods that use FTIR
Keep every FTIR in control: usage logs, calibration and maintenance schedules, and automatic blocking of overdue instruments.