Identification by FTIR
Confirms the identity of a raw material by recording its infrared spectrum and showing that it matches the spectrum of the reference substance (or the official reference spectrum) measured the same way.
- FTIR (ATR or KBr disc)
- FTIR
- Analytical balance
- Hot air oven
Reference: General approach described in Ph. Eur. 2.2.24, USP <854> and USP <197>. The monograph states which technique (KBr disc, ATR, film) and any sample treatment to use; always follow your approved specification and STP.
Why this method works
Each compound absorbs infrared light at a unique combination of wavenumbers, set by the vibrations of its bonds. The fingerprint region (about 1500–400 cm⁻¹) in particular is so characteristic that two different compounds almost never match. If the sample and the reference substance are measured under the same conditions and their bands appear at the same positions with similar relative intensities, the sample is identified as that substance.
Instruments used
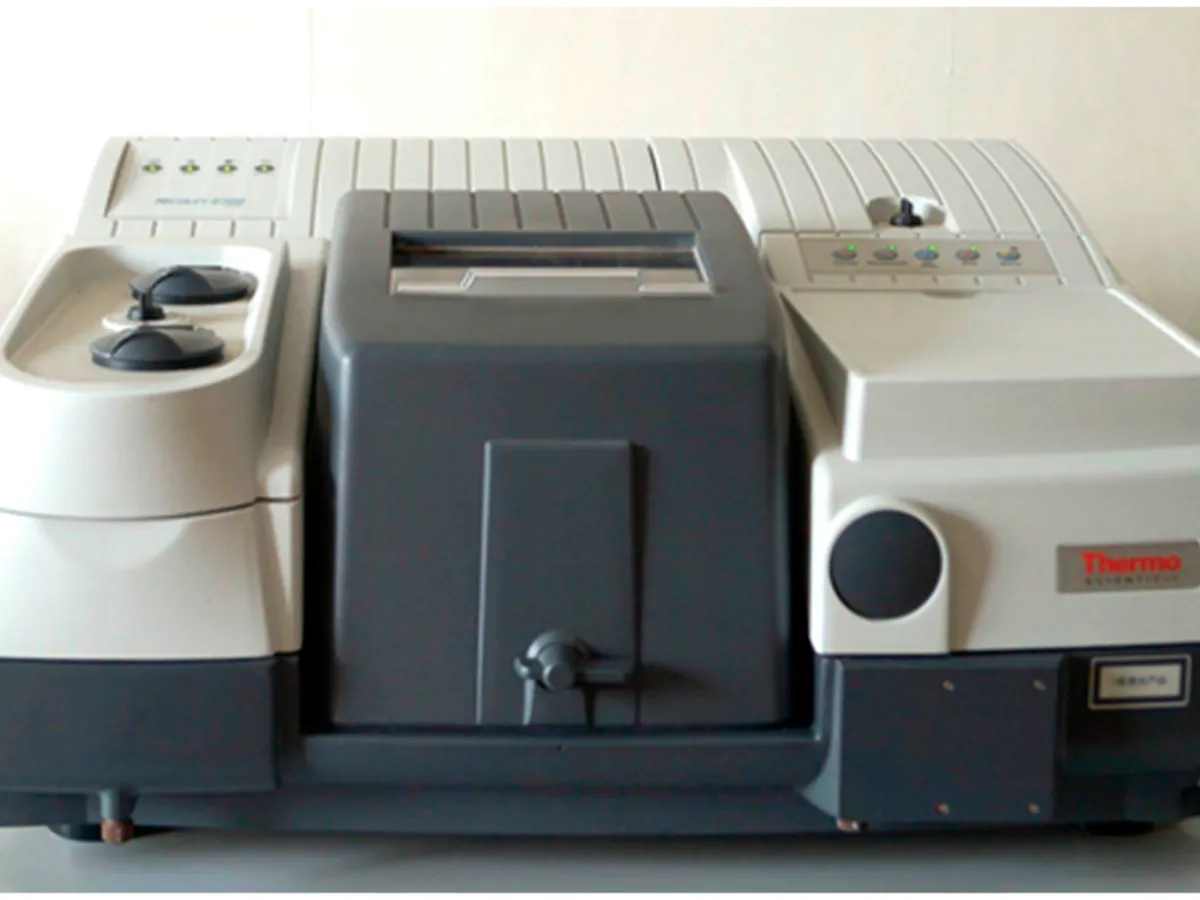
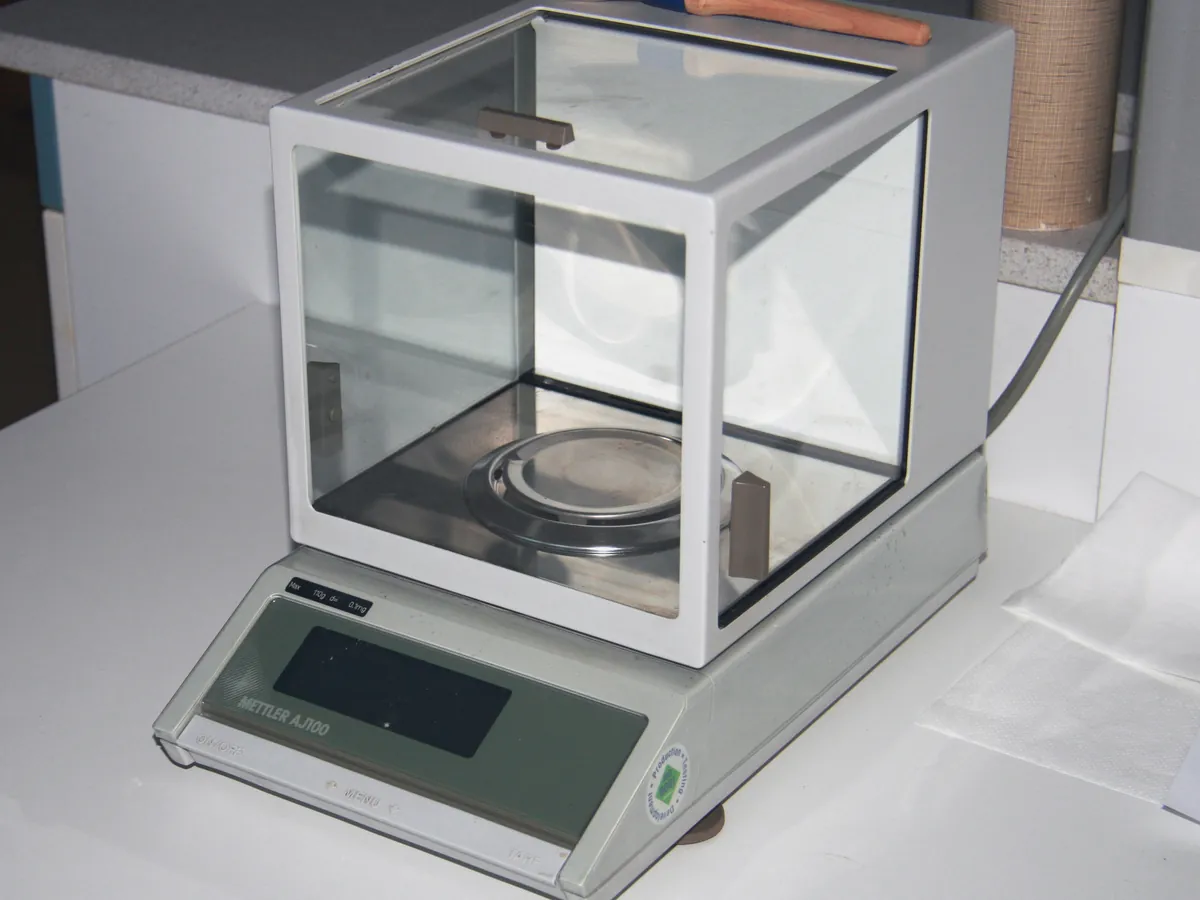
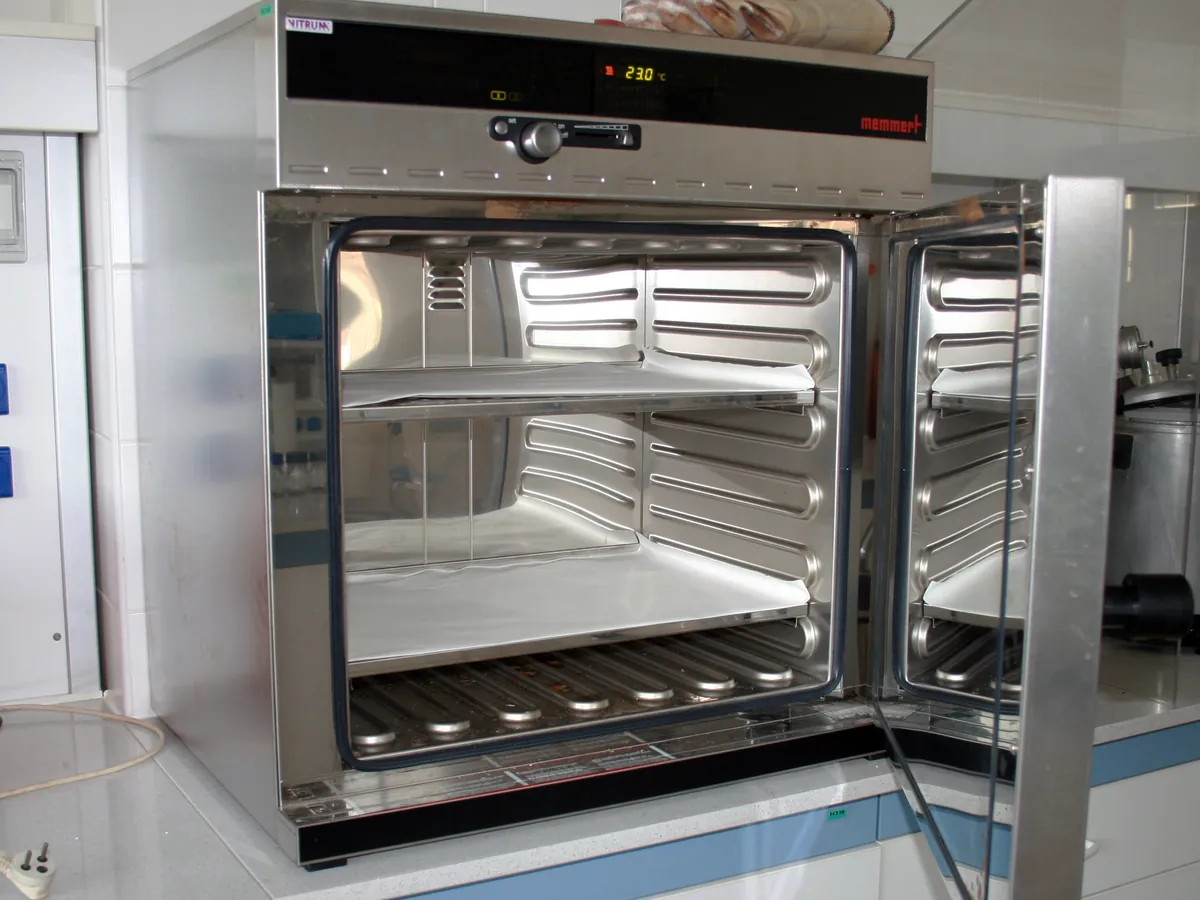
Reagents & standards
| Reagent | Grade / specification |
|---|---|
| Reference substance | Pharmacopoeial reference standard (Ph. Eur. CRS / USP RS / IP RS) or a qualified working standard; or the official reference spectrum where the monograph allows |
| Potassium bromide | IR grade, dried (for the KBr disc technique) |
| Cleaning solvent | Isopropanol or another solvent suitable for the ATR crystal |
| Recrystallisation solvent | Only if the monograph asks for sample and reference to be treated the same way to obtain the same crystal form |
Preparing the sample
- 01
Check instrument
Confirm calibration status and run the polystyrene check if your SOP requires it.
- 02
Background
Collect a background spectrum (clean ATR crystal or blank KBr disc).
- 03
Prepare sample
Place sample on the ATR crystal, or grind with dry KBr and press a disc.
- 04
Record spectrum
Scan the sample, typically 4000–400 cm⁻¹ at 4 cm⁻¹ resolution.
- 05
Reference
Record the reference substance in exactly the same way.
- 06
Compare
Overlay the spectra and compare band positions and relative intensities.
Procedure
- 1ATR technique: clean the crystal, collect a background, then place enough sample to cover the crystal. Lower the pressure clamp to the set position and record the spectrum.
- 2KBr disc technique: dry the potassium bromide as per the SOP. Grind about 1–2 mg of the sample with about 200–300 mg of dry KBr in an agate mortar until fine and uniform, and press into a clear disc under vacuum with the hydraulic press.
- 3Check the spectrum quality: the strongest band should not be flat-topped (typically below about 1.0–1.5 absorbance or above about 5–10 %T), the baseline should be reasonably flat, and water or CO₂ bands should be small.
- 4If the monograph specifies a sample treatment (for example drying, or dissolving and evaporating to dryness), apply the same treatment to the sample and the reference.
- 5Clean the crystal or die between measurements.
Standard preparation
- 1Prepare and record the reference substance by the same technique, on the same instrument and with the same settings as the sample.
- 2Where the monograph allows comparison with an official reference spectrum, use the spectrum obtained with the same technique (a KBr reference spectrum should not be compared directly with an ATR sample spectrum).
Notes for analysts
- Use the same technique for sample and reference: ATR spectra have relatively stronger bands at low wavenumbers than transmission spectra.
- Polymorphs, solvates and hydrates can give different spectra. This is not necessarily a failure; follow the monograph's treatment step before concluding.
- Some salts (for example hydrochlorides) can exchange ions with KBr during grinding, which changes the spectrum. Monographs may then specify potassium chloride discs or ATR.
- Keep KBr and discs dry: a broad band near 3400 cm⁻¹ and a band near 1640 cm⁻¹ usually mean absorbed water.
- Print or save the overlay with the identification of instrument, technique, date and analyst for the record.
Method parameters (typical)
| Spectral range | About 4000–400 cm⁻¹ (or 4000–650 cm⁻¹ for diamond ATR) |
|---|---|
| Resolution | Typically 4 cm⁻¹ (2 cm⁻¹ if the method requires) |
| Number of scans | Typically 16–32 for sample and background |
| Display | % transmittance or absorbance, same for sample and reference |
| Technique | As stated in the monograph or STP: ATR, KBr disc, liquid film or other |
System suitability & sequence
| Parameter | Limit |
|---|---|
| Instrument performance | Wavenumber accuracy check with polystyrene film passes (daily or as per SOP) |
| Background | Fresh background collected; no significant water vapour or CO₂ bands in the sample spectrum |
| Spectrum quality | Strongest band not saturated; adequate signal-to-noise |
Typical sequence
- 1Polystyrene performance check (as per SOP)
- 2Background spectrum
- 3Reference substance spectrum
- 4Background spectrum (if time has passed or the SOP requires)
- 5Sample spectrum
- 6Overlay and comparison
What result passes
- The spectrum of the sample shows absorption bands at the same positions as the reference substance, with similar relative intensities, across the whole range (paraphrasing Ph. Eur. 2.2.24 and USP <197>).
- If the spectra differ only because of crystal form, the monograph's instructions for treating sample and reference are applied and the comparison repeated.
- Where your SOP also uses a software correlation (hit-quality) value, it supports but does not replace visual comparison; the threshold is site-defined.
Validation parameters (ICH Q2(R2))
| Parameter | Typical requirement |
|---|---|
| Specificity | The key validation parameter: the method must distinguish the material from closely related substances (e.g. salts, analogues, other excipients) |
| Robustness | Effect of sample amount, ATR pressure and humidity on the spectrum is understood |
| Compendial methods | Pharmacopoeial identification tests are verified rather than fully validated; in-house library methods need specificity data |
Run this method in LimsPulse: specifications and STPs under version control, results calculated and checked against limits, and a signed Certificate of Analysis.