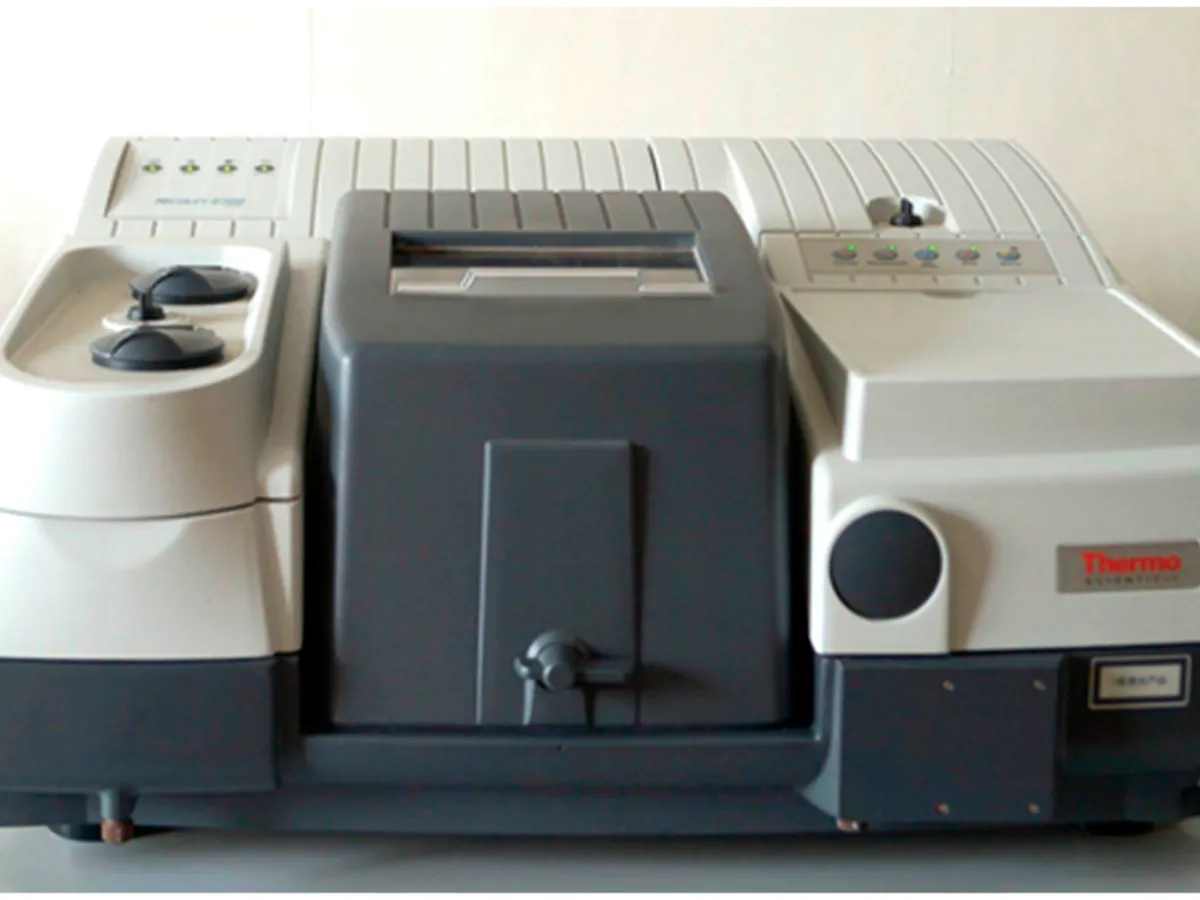
Fourier Transform Infrared (FTIR) Spectrometer
Records the infrared absorption spectrum of a sample, which acts as a molecular fingerprint. The standard technique for identification of APIs and excipients in pharma QC.
- Pharmaceutical
- Polymers & plastics
- Chemicals
- Forensics
- Food
- Academic research
How FTIR works
Infrared radiation is absorbed when its frequency matches a vibration of the molecule that changes its dipole moment. An FTIR passes the whole infrared range through a Michelson interferometer, records an interferogram (signal against mirror position) and converts it into a spectrum by a Fourier transform. A background spectrum is measured first and the sample spectrum is ratioed against it.
The path of a sample
- 01
IR source
A heated ceramic or silicon carbide element (globar) emits broadband mid-infrared light.
- 02
Interferometer
A beam splitter sends light to a fixed and a moving mirror; the recombined beams interfere, producing an interferogram that encodes every wavenumber at once.
- 03
Sample
The modulated beam passes through a KBr disc or reflects off an ATR crystal in contact with the sample.
- 04
Detector
A DTGS (room temperature) or MCT (liquid-nitrogen cooled) detector records the interferogram.
- 05
Fourier transform
The software converts the interferogram into a single-beam spectrum and ratios it against the background.
- 06
Spectrum and comparison
The final transmittance or absorbance spectrum is compared with a reference standard spectrum or library.
Main parts and what they do
IR source (globar)
Heated element that emits broadband mid-infrared radiation.
Michelson interferometer
Beam splitter (often KBr-based), fixed mirror and moving mirror that modulate the light into an interferogram.
He-Ne or diode reference laser
Tracks the moving-mirror position precisely, giving FTIR its built-in wavenumber accuracy.
Sample compartment / accessory
Holds a transmission holder for KBr discs and films, or an ATR accessory with a pressure clamp.
Detector
DTGS for routine work; MCT for higher sensitivity and speed.
Desiccant / purge
Keeps the optics dry; KBr optics are damaged by moisture. Some systems use dry-air or nitrogen purge.
Hydraulic press and die (for KBr)
Presses the KBr–sample mixture into a clear disc.
Software and spectral library
Performs the Fourier transform, comparison and correlation, and keeps the audit trail.
Terms every analyst should know
Wavenumber (cm⁻¹)
The number of waves per centimetre, equal to 10,000 divided by the wavelength in µm. Mid-IR runs from about 4000 to 400 cm⁻¹; higher wavenumber means higher energy.
Functional group vs fingerprint region
Bands above about 1500 cm⁻¹ point to specific groups (e.g. C=O near 1700 cm⁻¹, O–H near 3300 cm⁻¹). The complex pattern below 1500 cm⁻¹ is characteristic of the whole molecule.
Transmittance and absorbance
IR spectra are shown as %T (bands point down) or absorbance (bands point up). Absorbance is proportional to concentration, like UV.
ATR (attenuated total reflectance)
The sample is pressed onto a crystal (diamond, ZnSe or Ge). Light reflects inside the crystal and an evanescent wave penetrates a few micrometres into the sample. Fast and needs no preparation, but relative band intensities differ slightly from transmission spectra.
KBr disc (pellet)
About 1–2 mg of sample is ground with roughly 200–300 mg of dry potassium bromide and pressed into a transparent disc. The classic transmission method used in many monographs.
Background spectrum
A spectrum of the empty ATR crystal or a pure KBr disc, measured close in time to the sample, so that atmospheric water and CO₂ and instrument response cancel out.
Resolution and scans
Resolution (commonly 4 cm⁻¹ for identification) is set by the mirror travel. Co-adding more scans improves signal-to-noise by the square root of the number of scans.
Keep every FTIR in control: usage logs, calibration and maintenance schedules, and automatic blocking of overdue instruments.