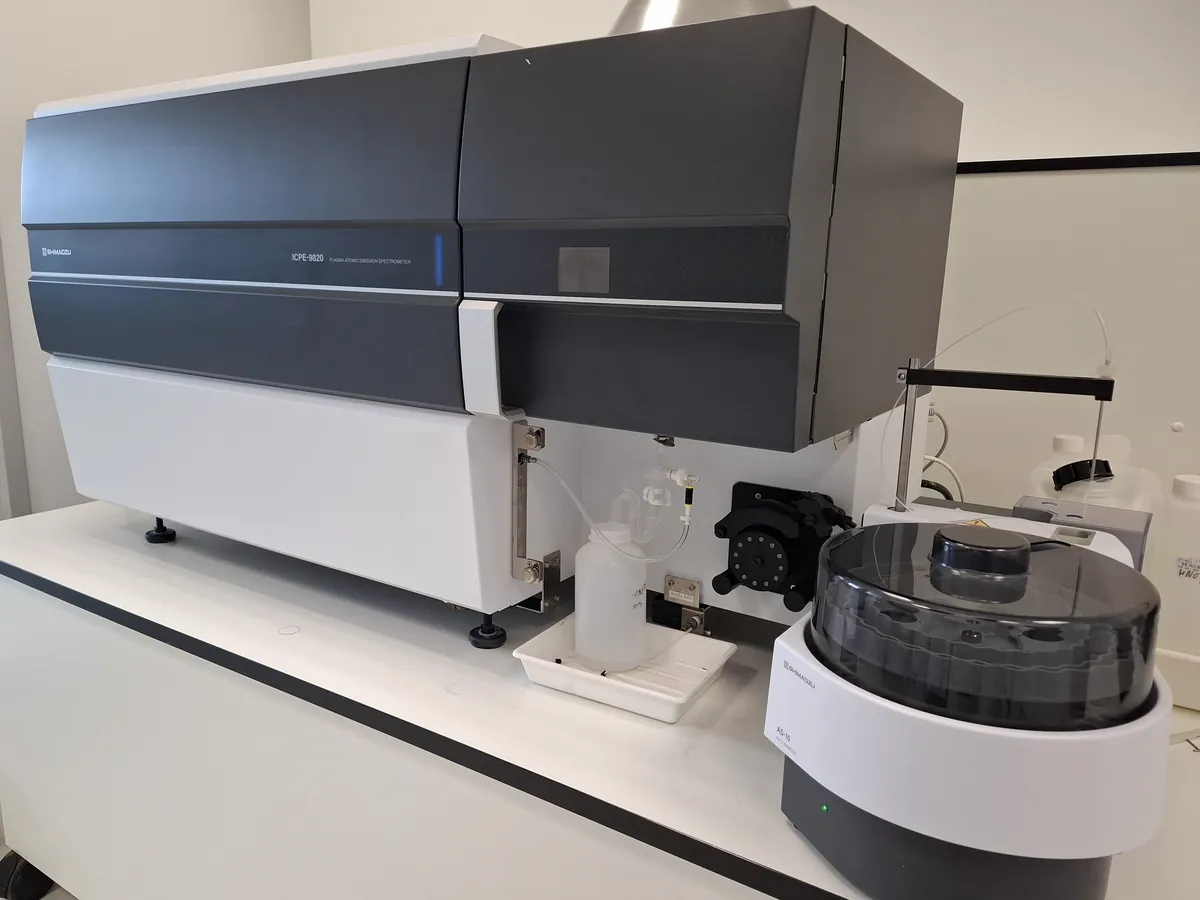
Inductively Coupled Plasma Optical Emission Spectrometer (ICP-OES)
Excites atoms in an argon plasma at about 6000–10,000 K and measures the light each element emits. Measures many elements at once from trace to percent levels.
- Pharmaceutical
- Environmental
- Food & beverage
- Petrochemical
- Mining & metallurgy
- Chemicals
How ICP-OES works
Atoms and ions excited in the plasma emit light at element-specific wavelengths. The intensity of an emission line is proportional to the element's concentration, so the instrument is calibrated with standard solutions and samples are read from the curve.
The path of a sample
- 01
Sample introduction
A peristaltic pump feeds the solution to a nebuliser, which forms an aerosol; the spray chamber removes large droplets.
- 02
Plasma
Fine droplets enter the argon plasma, where they are dried, vaporised, atomised, ionised and excited.
- 03
Emission
Excited atoms and ions emit light at characteristic wavelengths as they relax.
- 04
Viewing
The light is collected radially (side-on) or axially (end-on); axial viewing gives better detection limits.
- 05
Spectrometer
An echelle grating and prism disperse the light onto a solid-state (CCD/CID) detector.
- 06
Data system
Integrates line intensities, subtracts background and calculates concentrations from the calibration.
Main parts and what they do
Peristaltic pump and autosampler
Deliver sample at a constant rate and change samples automatically.
Nebuliser and spray chamber
Turn the liquid into a fine aerosol and remove large droplets.
Torch
Concentric quartz tubes carrying plasma, auxiliary and nebuliser argon flows.
RF generator and load coil
Supplies radio-frequency power (typically about 1–1.5 kW) that sustains the plasma.
Optical interface
Purged optics that collect light from the plasma in axial and/or radial view.
Echelle spectrometer
Disperses emitted light into its wavelengths with high resolution.
Solid-state detector
CCD or CID array that measures many lines simultaneously.
Software
Method set-up, calibration, line selection, interference correction and audit trail.
Terms every analyst should know
Inductively coupled plasma
Argon gas made electrically conductive and heated by a radio-frequency field from a copper load coil.
Atomic vs ionic lines
Lines labelled I come from neutral atoms, II from singly charged ions. Ionic lines are often strongest in the plasma.
Spectral interference
Another element emitting close to the analyte line. Avoided by choosing an alternative line or correcting with inter-element correction.
Background correction
Intensity measured beside the line is subtracted to remove plasma and matrix background.
Internal standard
An element such as yttrium or scandium added to all solutions to correct for drift and matrix effects on nebulisation.
Detection limit
Usually three times the standard deviation of repeated blank readings, converted to concentration with the calibration slope.
Keep every ICP-OES in control: usage logs, calibration and maintenance schedules, and automatic blocking of overdue instruments.