Purity by SDS-PAGE (reduced and non-reduced)
Separates the protein and its fragments, aggregates and other protein impurities by size on a polyacrylamide gel. The stained bands are scanned and the main band (or bands) is expressed as a percentage of all the protein in the lane. Running the sample both reduced and non-reduced shows different kinds of impurity.
- Biotech & biologics
- SDS polyacrylamide gel electrophoresis with Coomassie staining and densitometry
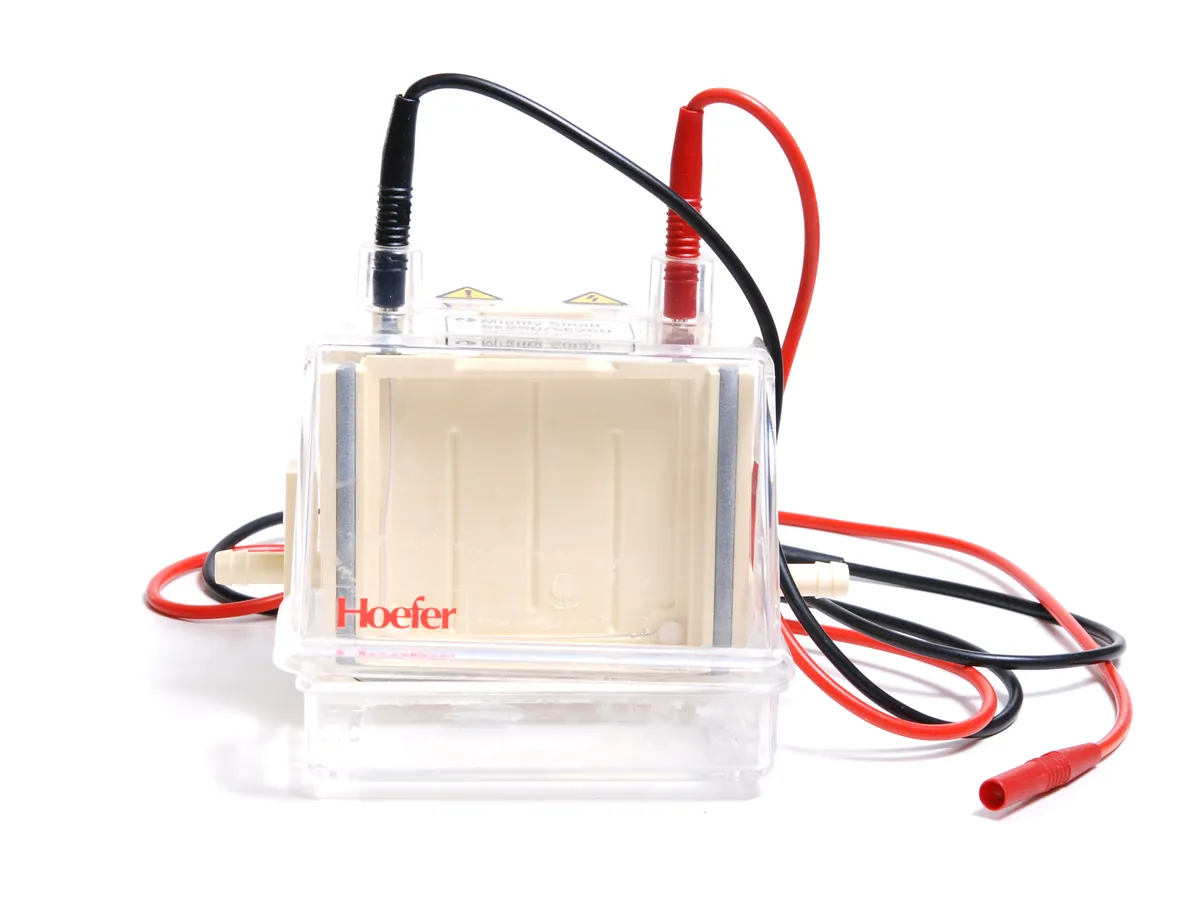
- Gel electrophoresis
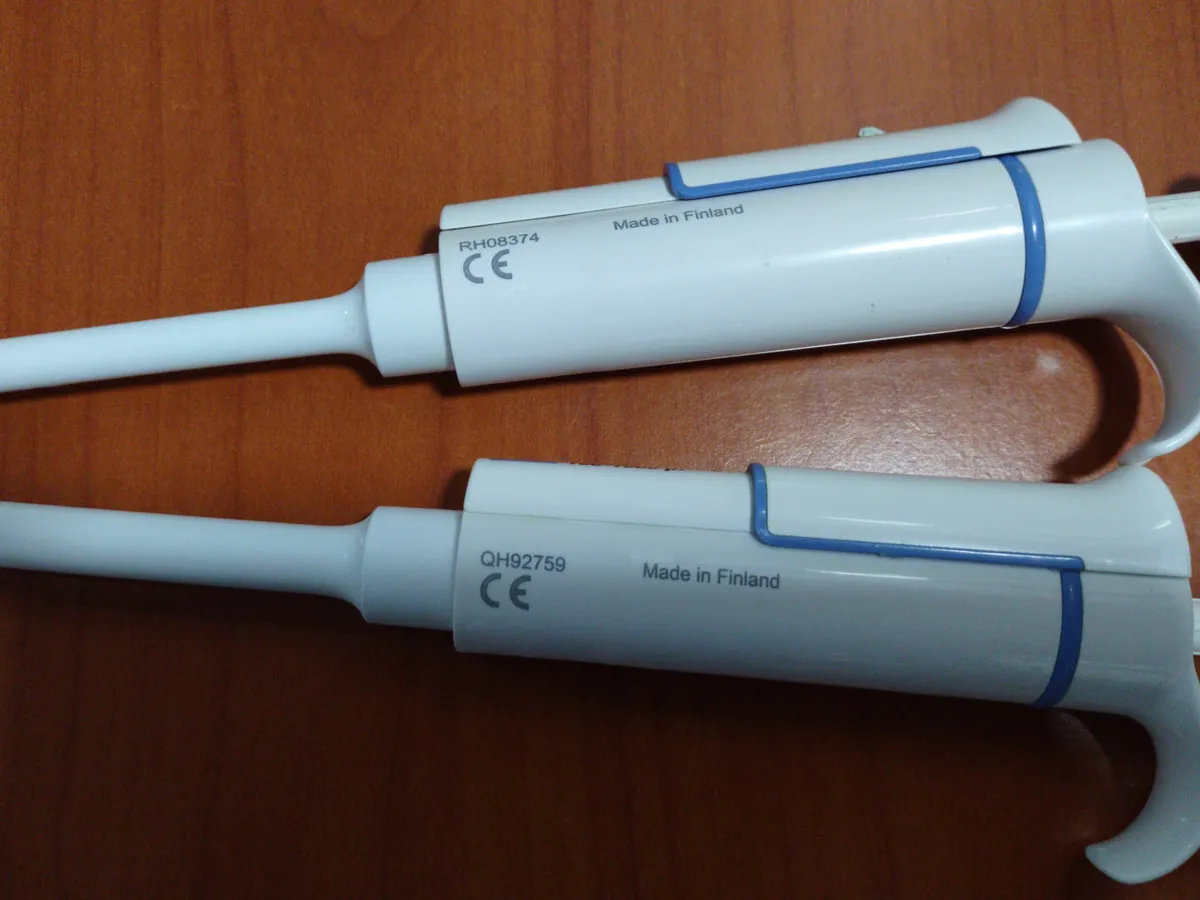
- Micropipette
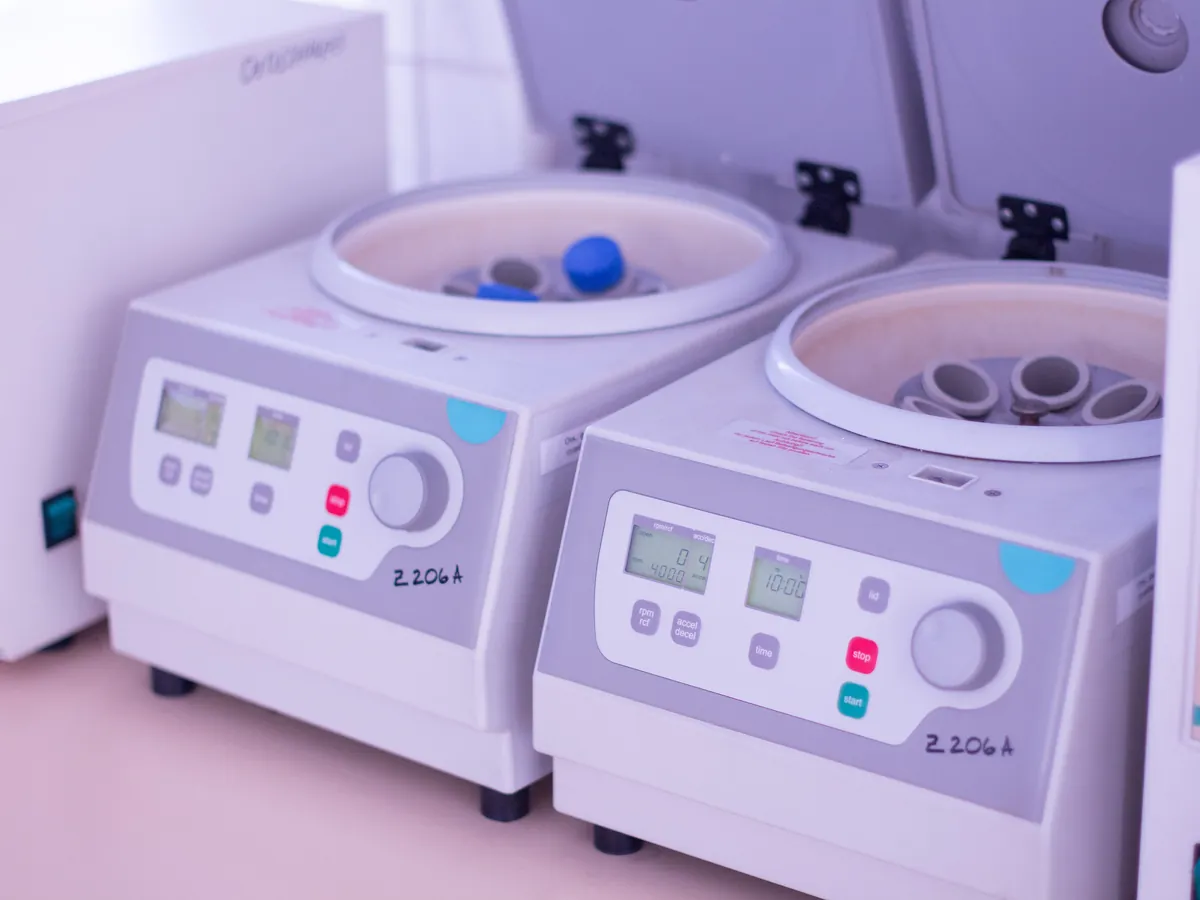
- Centrifuge
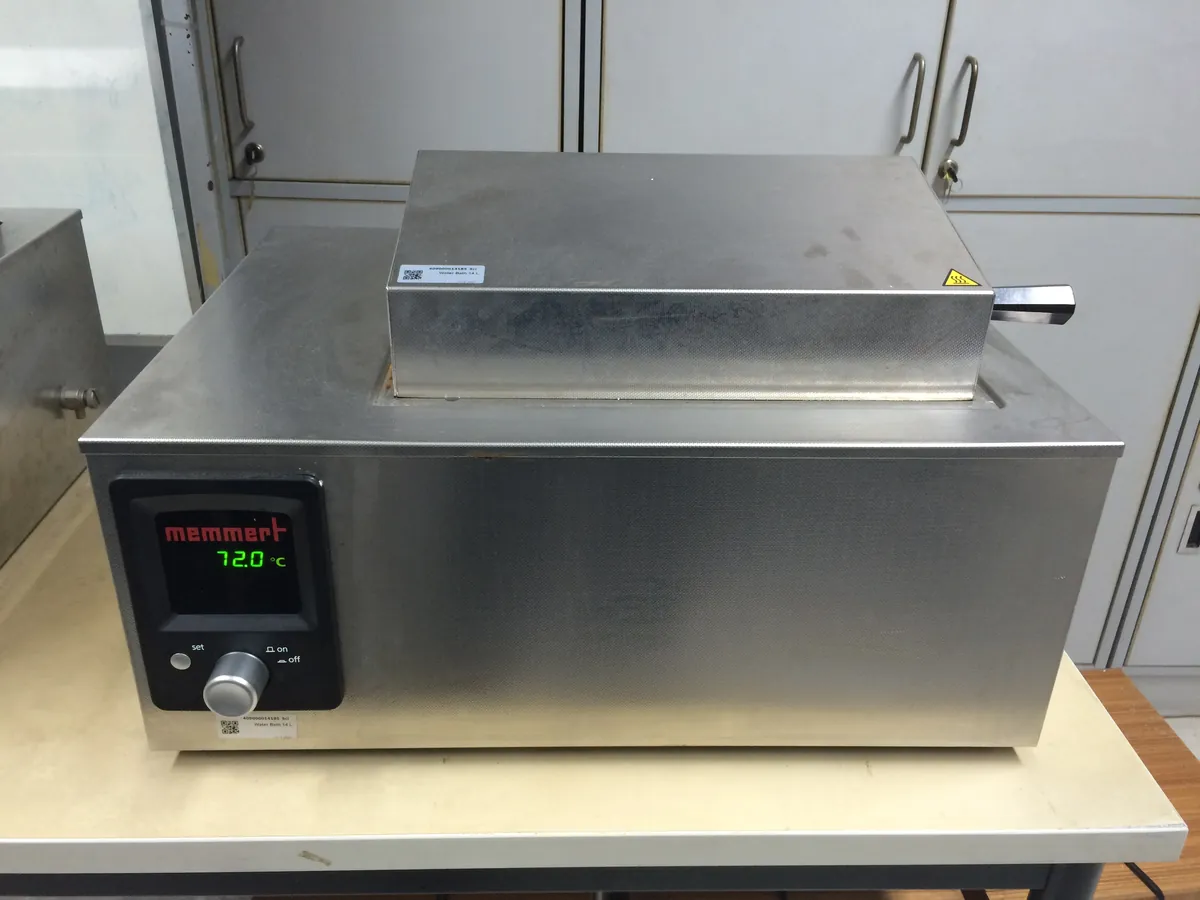
- Water bath
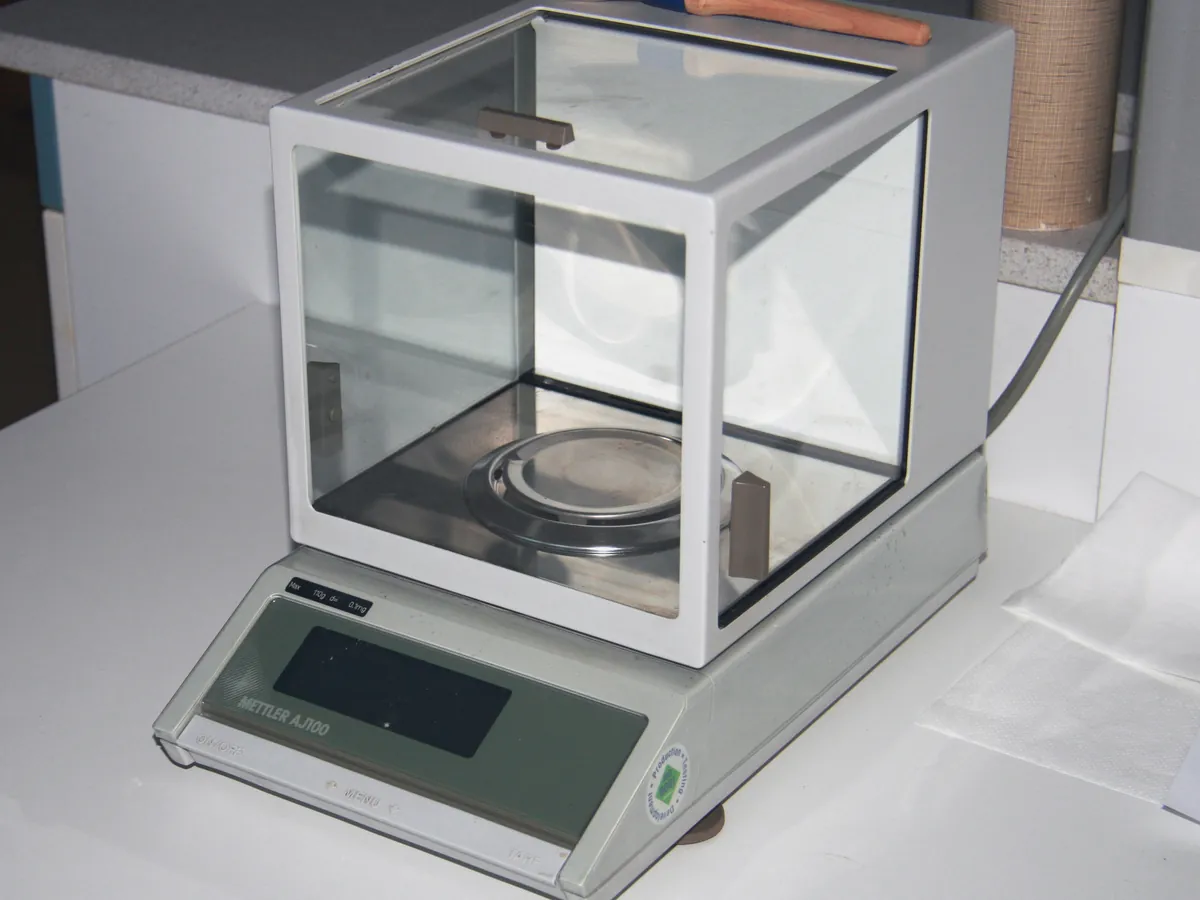
- Analytical balance
Reference: Typical method based on Ph. Eur. 2.2.31 and USP <1056>. Follow your approved test procedure and product specification.
Why this method works
Sodium dodecyl sulphate (SDS) binds to proteins at a roughly constant ratio, unfolds them and gives them a large uniform negative charge. In an electric field the SDS–protein complexes move towards the anode, and the gel's polymer mesh sieves them so smaller molecules travel further. Migration then depends mainly on size, not on native charge. Under reducing conditions (DTT or 2-mercaptoethanol) disulphide bonds are broken, so an IgG antibody runs as heavy chain (about 50 kDa) and light chain (about 25 kDa). Under non-reducing conditions the intact molecule (about 150 kDa) stays together, and partly assembled forms (for example heavy–heavy–light, half-antibody, free light chain) and covalent aggregates appear as separate bands. After staining, a densitometer or calibrated scanner measures the intensity of each band, and purity is the main band intensity as a percentage of the total lane intensity.
Instruments used
Reagents & standards
| Reagent | Grade / specification |
|---|---|
| Precast gel | e.g. 4–20% Tris-glycine or 4–12% Bis-Tris gradient gel, as validated |
| Running buffer | Tris-glycine-SDS or MOPS/MES-SDS, matching the gel chemistry |
| Sample buffer | SDS sample (Laemmli-type) buffer with tracking dye and glycerol |
| Reducing agent | Dithiothreitol (DTT) or 2-mercaptoethanol, for reduced samples |
| Alkylating agent | Iodoacetamide or N-ethylmaleimide, for non-reduced samples (blocks free thiols) |
| Molecular weight marker | Pre-stained or unstained protein ladder covering about 10–250 kDa |
| Stain | Coomassie Brilliant Blue (colloidal) or silver stain kit, as validated |
| Reference standard | In-house reference standard of the same protein |
| Water | Purified water |
Preparing the sample
- 01
Dilute
Dilute sample and reference standard to the same protein concentration.
- 02
Add buffer
Mix with SDS sample buffer, plus reductant or alkylating agent.
- 03
Heat
Heat to denature (reduced and non-reduced at their validated conditions).
- 04
Spin
Cool and centrifuge briefly to collect the liquid.
- 05
Load & run
Load equal protein amounts and run at constant voltage.
- 06
Stain & scan
Fix, stain, destain and scan the gel for densitometry.
Procedure
- 1Dilute the sample and the reference standard with purified water or formulation buffer to the same concentration, typically about 1 mg/mL, using the protein concentration from the A280 or other content test.
- 2Reduced preparation: mix the diluted protein with sample buffer containing DTT (or 2-mercaptoethanol) and heat, typically at about 70–95 °C for a few minutes, as validated for the product.
- 3Non-reduced preparation: mix with sample buffer containing iodoacetamide (or N-ethylmaleimide) and no reductant, then heat at the validated, usually milder, condition. Alkylation stops disulphide scrambling, which would otherwise create artefact bands.
- 4Cool, centrifuge briefly and load equal amounts of protein in each lane, for example 5–10 µg for Coomassie staining. Load the molecular weight marker and the reference standard on the same gel.
- 5Prepare a sensitivity solution by diluting the sample (or reference standard) to the reporting level, for example 1% of the test load, and load it in its own lane.
- 6Run at constant voltage in the electrophoresis tank until the dye front reaches the bottom of the gel, keeping the buffer cool.
- 7Fix and stain the gel, destain to a clear background, and scan it on a calibrated densitometer or imaging system within the validated time.
Standard preparation
- 1Prepare the in-house reference standard exactly as the sample, both reduced and non-reduced, at the same load.
- 2Load the molecular weight marker to estimate apparent molecular weights.
- 3Prepare the sensitivity solution (e.g. 1% of the test load) from the sample or reference standard to show the stain can detect a band at the reporting level.
Notes for analysts
- Densitometry is semi-quantitative: Coomassie binds different proteins slightly differently and the stain response flattens at high loads. Capillary electrophoresis with SDS (CE-SDS) is now often used for the quantitative release purity test, with SDS-PAGE kept for identity or characterisation.
- Too much heat or long heating of non-reduced samples can create fragment bands that are artefacts of the method, not the product. Validate the heating step.
- Glycosylated heavy chain runs as a slightly diffuse band; a faint band just below it is often non-glycosylated heavy chain.
- Use the same scanner settings for every gel and stay within the linear range of the imaging system.
Method parameters (typical)
| Gel | Precast gradient gel, e.g. 4–20% Tris-glycine (or 4–12% Bis-Tris), as validated |
|---|---|
| Load | Typically 5–10 µg protein per lane (Coomassie); less for silver stain |
| Running conditions | Constant voltage, e.g. about 150–200 V, until the dye front reaches the end of the gel |
| Reduction | DTT or 2-mercaptoethanol, heated as validated |
| Non-reduced | Alkylated with iodoacetamide or N-ethylmaleimide; no reductant |
| Detection | Colloidal Coomassie (or silver) stain; densitometric scan |
| Reporting | Main band(s) % of total lane intensity; individual impurity bands at or above the reporting level |
System suitability & sequence
| Parameter | Limit |
|---|---|
| Molecular weight marker | Bands well resolved across the range of interest |
| Reference standard | Band pattern and % purity consistent with its established profile |
| Sensitivity solution | Band visible and quantifiable at the reporting level (e.g. 1% load) |
| Gel quality | Straight lanes, no smiling or streaking that would affect integration |
| Blank lane | No interfering bands from sample buffer |
Typical sequence
- 1Molecular weight marker
- 2Reference standard, reduced
- 3Sample 1 and 2, reduced
- 4Sensitivity solution
- 5Reference standard, non-reduced
- 6Sample 1 and 2, non-reduced
- 7Blank (sample buffer only), lanes not used left empty or loaded with buffer
Calculation with a worked example
Where
- Main bands
- Reduced: heavy chain + light chain. Non-reduced: intact molecule band
- Total lane intensity
- Sum of all integrated bands in the lane above the reporting level, background-subtracted
Given
- Heavy chain band volume
- 1,215,400
- Light chain band volume
- 598,700
- Impurity band 1 (non-glycosylated heavy chain)
- 24,300
- Impurity band 2
- 15,800
- Impurity band 3
- 9,100
Working
- 1
Main bands = 1,215,400 + 598,700 = 1,814,100
- 2
Total lane = 1,814,100 + 24,300 + 15,800 + 9,100 = 1,863,300
- 3
% purity = 1,814,100 / 1,863,300 × 100 = 97.36%
- 4
Impurity 1 = 24,300 / 1,863,300 × 100 = 1.30%; impurity 2 = 0.85%; impurity 3 = 0.49%
Reduced SDS-PAGE purity (HC + LC) = 97.4%; largest single impurity band 1.3%
What result passes
- Band pattern of the sample matches the reference standard (same main bands at the same apparent molecular weights).
- Purity not less than the limit in the product specification, for example ≥ 95% for the main band(s); the actual limit is product-specific.
- No new band above the reporting level that is absent from the reference standard.
Validation parameters (ICH Q2(R2))
| Parameter | Typical requirement |
|---|---|
| Specificity | Main bands resolved from expected fragments and aggregates; stressed (heat- or light-degraded) samples used to show degradants are seen |
| Linearity of response | Band intensity proportional to load over the working range, e.g. reporting level to about 120% of the test load |
| Detection / quantitation limit | Lowest load reliably seen / measured, usually set at or below the reporting level |
| Precision | Repeatability and intermediate precision of % purity across gels, days and analysts |
| Robustness | Heating time and temperature, staining time, gel lot |
Run this method in LimsPulse: specifications and STPs under version control, results calculated and checked against limits, and a signed Certificate of Analysis.