Atmospheric Distillation Apparatus
Distils 100 mL of a fuel from a flask at a controlled rate and records the vapour temperature as each volume is collected. The resulting curve (IBP, T10, T50, T90, FBP) describes how the fuel evaporates.
- Petroleum refining
- Fuel terminals and retail quality control
- Aviation fuel quality
- Solvent manufacture
- Independent testing laboratories
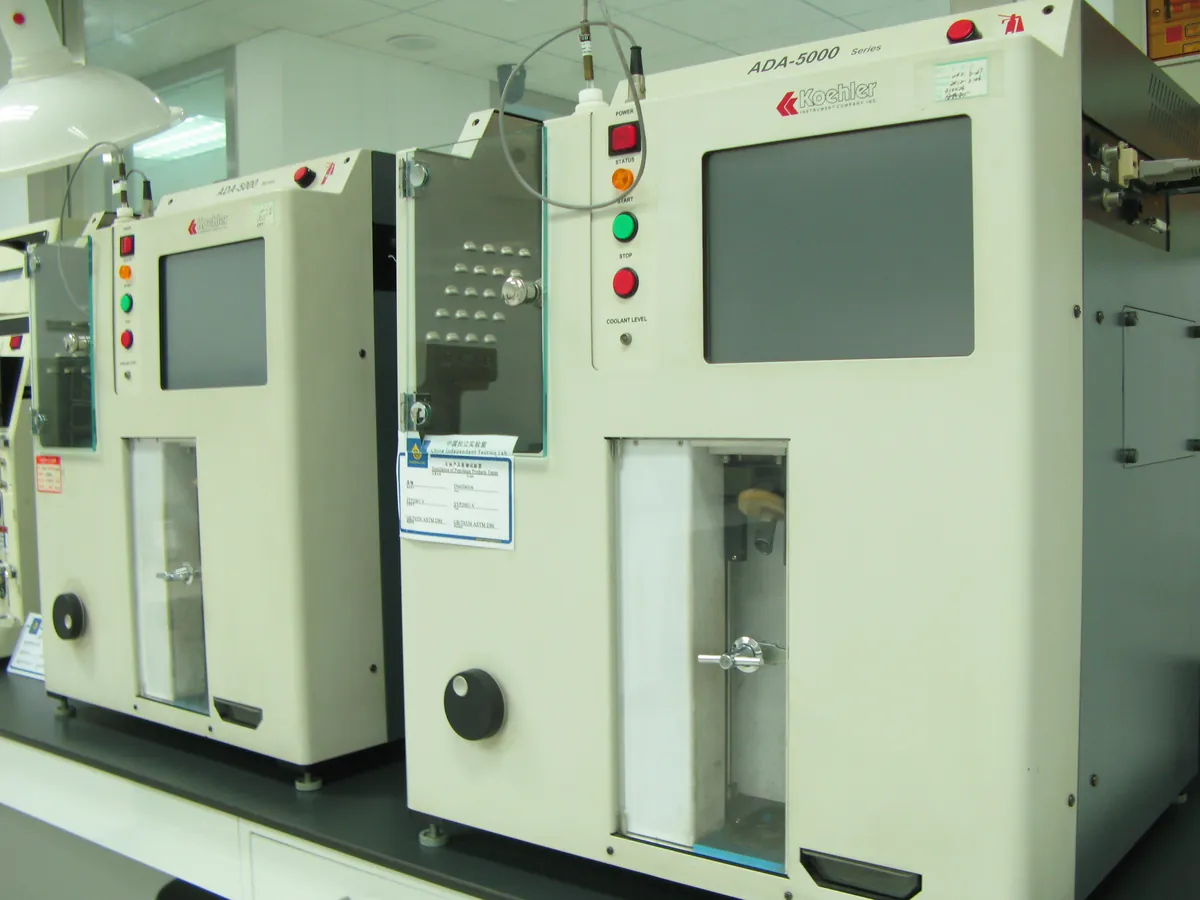
How Distillation unit works
A fuel is boiled at a steady rate in a standard flask. The vapour passes over a temperature sensor placed at the flask side-arm, is condensed in a cooled tube and collected in a graduated receiver. Plotting vapour temperature against volume recovered gives the distillation curve, which reflects the spread of boiling points in the fuel.
The path of a sample
- 01
Charge
100 mL of sample, measured in the receiving cylinder at the specified temperature, is poured into a 125 mL distillation flask.
- 02
Assemble
The temperature sensor is fitted centrally so the top of its bulb is level with the lower edge of the side-arm; the flask is connected to the condenser.
- 03
Heat to IBP
Heat is applied so the first drop falls from the condenser within the time set for the sample group (typically 5–15 minutes). This temperature is the IBP.
- 04
Steady distillation
Heat is adjusted to keep a uniform rate of about 4–5 mL per minute; temperatures are recorded at set volumes (5, 10, 20 … 90, 95 mL).
- 05
End point
When about 5 mL remain in the flask, heat is adjusted so the end point is reached within a set time; the maximum temperature is the FBP.
- 06
Residue and loss
After cooling, the residue in the flask is measured. Loss = 100 − (recovery + residue).
Main parts and what they do
Distillation flask
125 mL borosilicate flask with a side-arm, of specified dimensions.
Flask support board
Ceramic board with a hole of set diameter (size depends on the sample group) that controls how much of the flask is heated.
Heater
Electric heater (or gas burner in old units) with fine power control.
Temperature sensor
ASTM-specified mercury thermometer or a Pt100 / thermocouple with lag correction, placed at the side-arm.
Condenser and cooling bath
Metal tube in a temperature-controlled bath that condenses the vapour; temperature set by sample group.
Receiving cylinder
100 mL graduated cylinder in a temperature-controlled enclosure; an optical level follower reads volume in automatic units.
Barometer
Measures atmospheric pressure for temperature and loss corrections.
Fire detection and extinguishing
Flame or temperature sensor that cuts the heater and floods the chamber with CO₂ or nitrogen if a fire starts.
Controller and software
Controls heat to hold the distillation rate, records the curve and calculates corrected values.
Terms every analyst should know
Sample groups
D86 sorts samples into Groups 1–4 by volatility. Each group has its own sample and condenser temperatures and timing rules; for example volatile petrol uses a condenser near 0–1 °C, while diesel (Group 4) may use a warmer condenser.
Per cent recovered vs evaporated
Per cent recovered is the volume read in the receiver. Per cent evaporated adds the loss to it. Petrol specifications often use evaporated values.
Barometric (Sydney Young) correction
Boiling temperatures fall at lower pressure, so readings are corrected to 101.3 kPa: Cc = 0.0009 × (101.3 − Pk) × (273 + tc), with Pk in kPa and tc in °C.
Thermometer lag
Electronic sensors respond faster than mercury thermometers. Automatic units apply a lag correction so results match the historical mercury-thermometer values.
Dry point and decomposition point
The dry point is when the last drop of liquid evaporates from the flask bottom. The decomposition point is the temperature at which heavy samples start to crack, shown by fumes and a falling temperature.
Keep every Distillation unit in control: usage logs, calibration and maintenance schedules, and automatic blocking of overdue instruments.