Charge variants by capillary isoelectric focusing (cIEF / icIEF)
Separates the protein's charge variants by their isoelectric point (pI) in a pH gradient inside a capillary. Peaks are assigned to acidic, main and basic regions and reported as area percentages. Two pI markers in every sample let the pI of each peak be calculated.
- Biotech & biologics
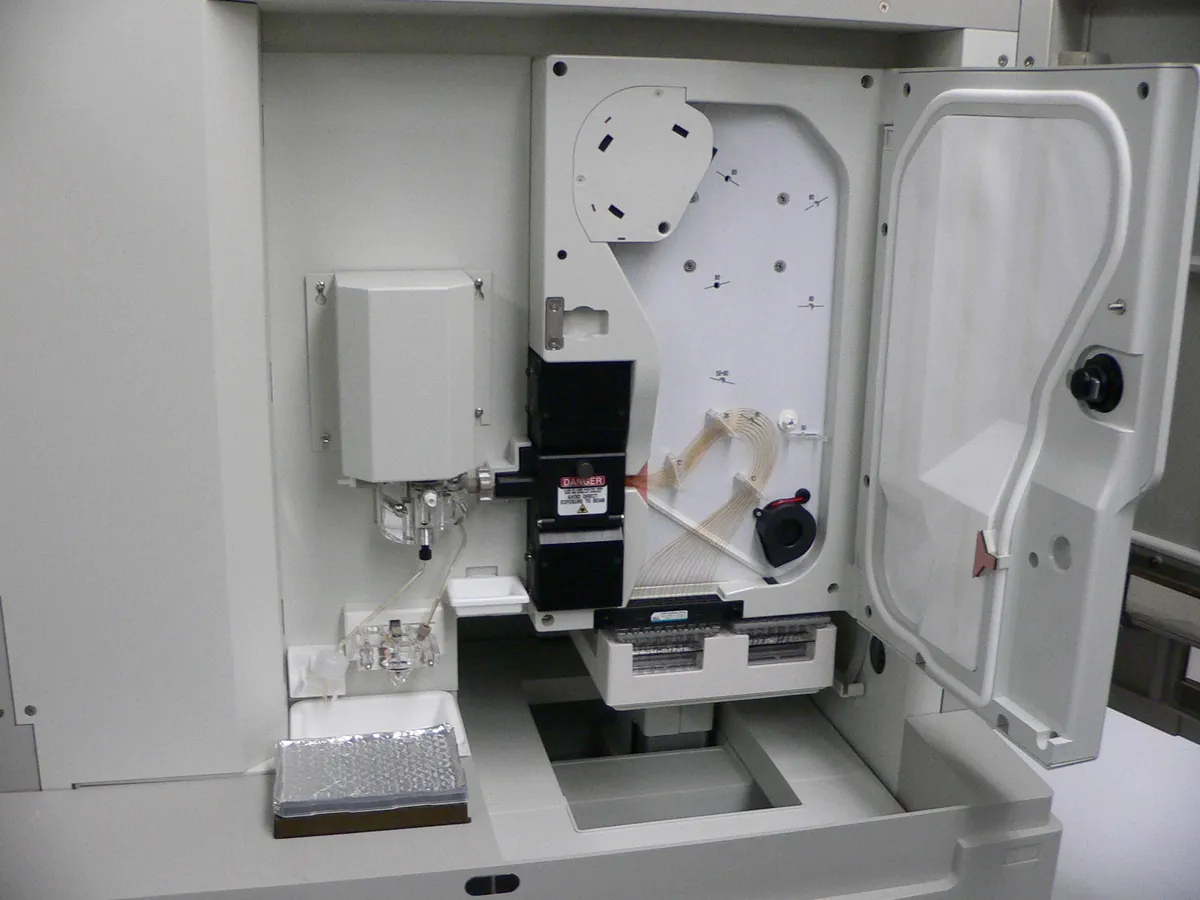
- Capillary isoelectric focusing with UV (280 nm) whole-column imaging or mobilisation
- CE
- Micropipette
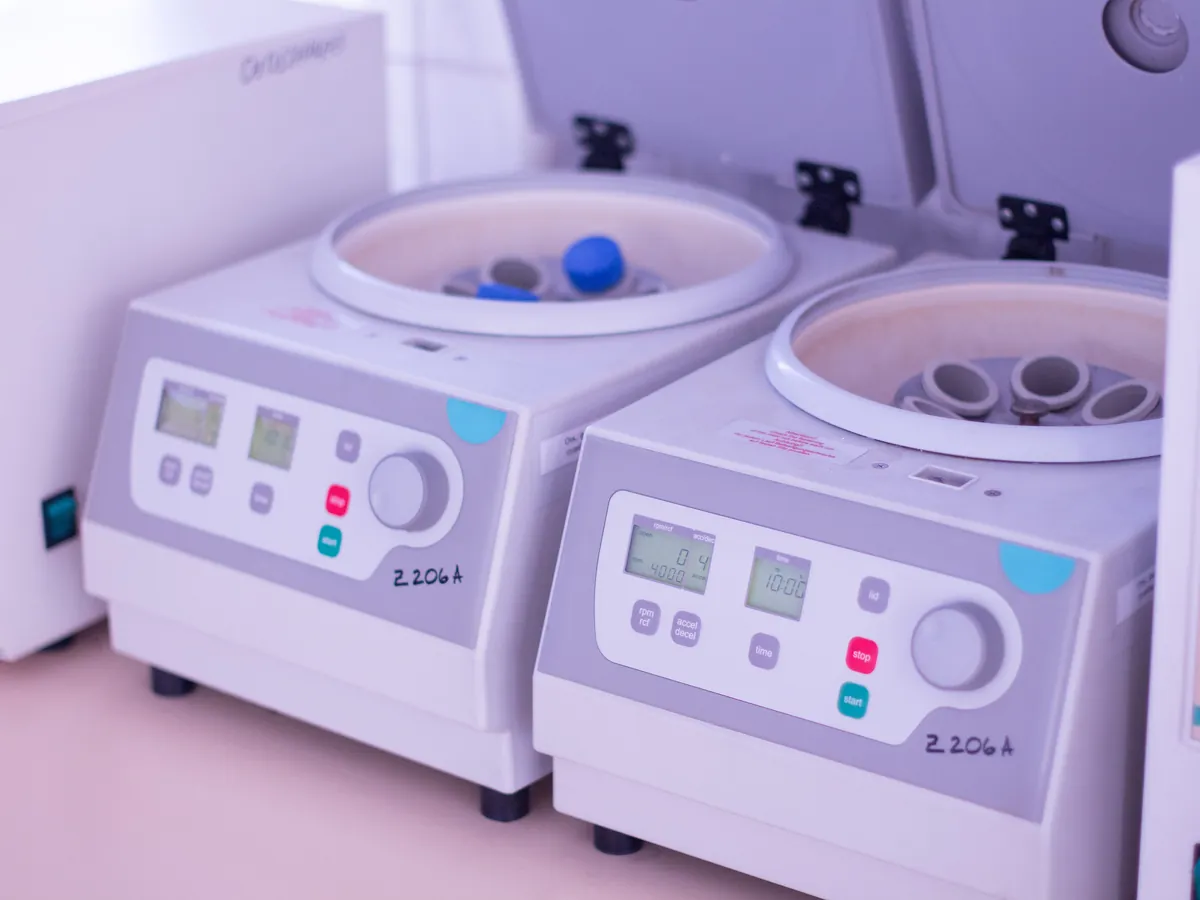
- Centrifuge
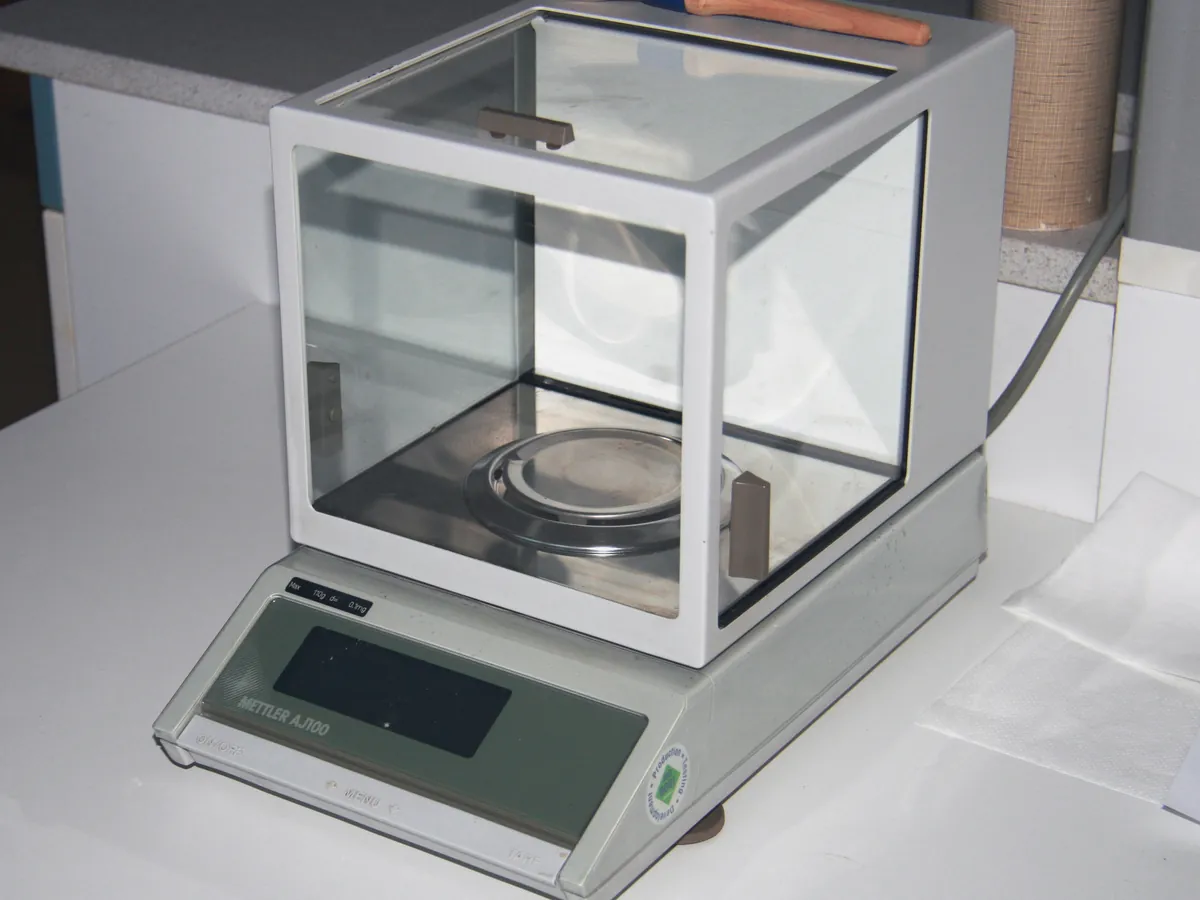
- Analytical balance
Reference: Typical method based on Ph. Eur. 2.2.47, USP <1053> and USP <1054>. Follow your approved test procedure and product specification.
Why this method works
A protein's net charge depends on pH. At its isoelectric point the net charge is zero and it stops moving in an electric field. In cIEF the sample is mixed with carrier ampholytes — a mixture of many small amphoteric molecules — which, when voltage is applied, form a stable pH gradient along the capillary (low pH at the anode, high pH at the cathode). Each protein variant migrates until it reaches the pH equal to its pI and then focuses into a sharp zone. Modifications that change charge separate out: deamidation, sialylation and glycation of lysine make variants more acidic; unprocessed C-terminal lysine and C-terminal amidation make variants more basic. In imaged cIEF (icIEF) a camera images the whole capillary at 280 nm after focusing, so there is no mobilisation step. In conventional cIEF the focused zones are pushed past a single detector by chemical or pressure mobilisation. Two pI markers of known pI bracket the protein and are used to convert position to pI by linear interpolation.
Instruments used
Reagents & standards
| Reagent | Grade / specification |
|---|---|
| Carrier ampholytes | e.g. pH 3–10 broad range, sometimes mixed with a narrow range (e.g. 8–10.5) for basic proteins |
| Methylcellulose solution | e.g. 1% stock; reduces electro-osmotic flow and stabilises the gradient |
| Urea (optional) | Helps solubility and limits precipitation at the pI, if validated |
| pI markers | Two synthetic peptide (or small molecule) markers bracketing the protein, e.g. pI 7.05 and 9.50 |
| Anolyte and catholyte | e.g. dilute phosphoric acid and sodium hydroxide, as specified by the system |
| Cathodic / anodic blockers | e.g. arginine and iminodiacetic acid, to stop the gradient running into the ends of the capillary |
| Reference standard | In-house reference standard of the same protein |
Preparing the sample
- 01
Desalt if needed
Reduce salt by dilution or buffer exchange.
- 02
Master mix
Mix ampholytes, methylcellulose, blockers and pI markers.
- 03
Add protein
Add sample to give the working protein concentration.
- 04
Spin
Centrifuge to remove air bubbles and particles.
- 05
Focus & image
Pre-focus, focus at high voltage, then image at 280 nm.
Procedure
- 1If the formulation contains much salt, dilute or buffer-exchange the sample into water or a low-ionic-strength buffer. High salt raises current, heats the capillary and distorts the gradient.
- 2Prepare a master mix containing carrier ampholytes, methylcellulose, cathodic and anodic blockers, the two pI markers and urea if used.
- 3Add sample (or reference standard) to the master mix to give the validated final protein concentration, typically a few tenths of a mg/mL.
- 4Mix gently and centrifuge to remove air bubbles and particles, which can block the capillary or cause spikes.
- 5Load the vials into the instrument. Typical icIEF conditions are a short pre-focus at about 1,500 V followed by focusing at about 3,000 V for several minutes, then imaging at 280 nm.
Standard preparation
- 1Prepare the reference standard exactly as the sample, with the same master mix and protein concentration.
- 2Run a blank (master mix with water instead of protein) to show ampholyte and marker peaks only.
Notes for analysts
- Charge variants are often product-related substances, not impurities: many have the same activity as the main form. ICH Q6B expects them to be characterised and controlled consistently.
- Carrier ampholyte lots differ slightly; qualify each new lot against the reference standard.
- Cation-exchange chromatography (CEX-HPLC) is an orthogonal method for charge variants and some labs use it for release instead of cIEF.
- Do not vortex the sample–master mix: methylcellulose and foaming trap air bubbles, which cause spikes in the image.
Method parameters (typical)
| System | Imaged cIEF (whole-column UV imaging) or CE with cIEF mobilisation, as validated |
|---|---|
| Capillary | Coated (neutral) capillary or icIEF cartridge |
| Ampholytes | e.g. pH 3–10, final about 4% v/v (product-specific blend) |
| pI markers | Two markers bracketing the main peak, e.g. 7.05 and 9.50 for a basic antibody |
| Focusing | e.g. 1 min at 1,500 V then about 6–10 min at 3,000 V |
| Detection | UV 280 nm |
| Sample tray temperature | About 10 °C |
System suitability & sequence
| Parameter | Limit |
|---|---|
| pI markers | Both markers detected and focused; calculated pI of the reference standard main peak within its established range (e.g. ±0.1 pH unit) |
| Reference standard profile | % acidic, % main and % basic within established ranges |
| Precision | Replicate injections of the reference standard meet the %RSD set in the procedure for main peak area % |
| Blank | No peaks in the protein region other than known ampholyte background |
Typical sequence
- 1Blank (master mix) × 1
- 2Reference standard × 3
- 3Sample preparations in duplicate
- 4Bracketing reference standard × 1
Calculation with a worked example
Where
- pI₁, pI₂
- Known pI of the lower and higher marker
- x₁, x₂
- Positions of the lower and higher marker (pixel or time)
- x
- Position of the protein peak
- A(region)
- Summed peak area in the acidic, main or basic region
Given
- Lower marker
- pI 7.05 at pixel 1,020
- Higher marker
- pI 9.50 at pixel 1,820
- Main peak position
- Pixel 1,530
- Acidic region area
- 1,452
- Main peak area
- 4,468
- Basic region area
- 812
Working
- 1
Slope = (9.50 − 7.05) / (1,820 − 1,020) = 2.45 / 800 = 0.0030625 pH units per pixel
- 2
pI(main) = 7.05 + (1,530 − 1,020) × 0.0030625 = 7.05 + 1.562 = 8.61
- 3
Total area = 1,452 + 4,468 + 812 = 6,732
- 4
% acidic = 1,452 / 6,732 × 100 = 21.6%; % main = 4,468 / 6,732 × 100 = 66.4%; % basic = 812 / 6,732 × 100 = 12.1%
Main peak pI 8.61; acidic 21.6%, main 66.4%, basic 12.1% (sum 100.1% from rounding)
What result passes
- Electropherogram profile comparable to the reference standard (same peaks, no new significant peaks).
- Main peak pI within the specified range, e.g. reference standard pI ± a stated tolerance.
- % acidic, % main and % basic within the product specification limits, which are set from batch history and clinical experience.
Validation parameters (ICH Q2(R2))
| Parameter | Typical requirement |
|---|---|
| Specificity | Stressed samples (e.g. high pH or high temperature to increase deamidation; carboxypeptidase B treatment to remove C-terminal lysine) show expected shifts |
| Linearity | Peak area linear with protein concentration over the working range |
| Precision | Repeatability and intermediate precision of % regions and main peak pI |
| Robustness | Ampholyte lot, focusing time, urea and methylcellulose concentration, protein load |
Run this method in LimsPulse: specifications and STPs under version control, results calculated and checked against limits, and a signed Certificate of Analysis.