Protein Concentration by UV Absorbance at 280 nm (A280)
The protein solution is diluted with its formulation buffer so the absorbance is in the linear range, absorbance is measured at 280 nm (with a 320 nm scatter correction) against the buffer blank, and concentration is calculated with the Beer–Lambert law using the protein's extinction coefficient.
- Biotech & biologics
- UV spectrophotometry
- UV-Vis
- Micropipette
Reference: Typical method based on USP <1057> (Method 1, UV absorbance) and Ph. Eur. 2.5.33 (Method 1). The extinction coefficient and dilution scheme come from the product's validated procedure.
Why this method works
Proteins absorb UV light near 280 nm mainly because of the aromatic side chains of tryptophan and tyrosine, with a small contribution from disulphide bonds (cystine). By the Beer–Lambert law, A = ε × c × l, so concentration c = A ÷ (ε × l). For a pure protein of known sequence, the molar extinction coefficient can be calculated from its composition, for example ε280 (M⁻¹ cm⁻¹) ≈ 5500 × (number of Trp) + 1490 × (number of Tyr) + 125 × (number of cystines). Dividing by molar mass gives the mass extinction coefficient in mL mg⁻¹ cm⁻¹ (the absorbance of a 1 mg/mL solution in 1 cm), which is about 1.3–1.5 for most IgG antibodies. The method is fast, non-destructive and needs no standard curve, but it assumes the protein is pure and that nothing else in the solution absorbs at 280 nm. Light scattering from aggregates raises the apparent absorbance, so absorbance at 320 nm (where protein does not absorb) is often subtracted.
Instruments used
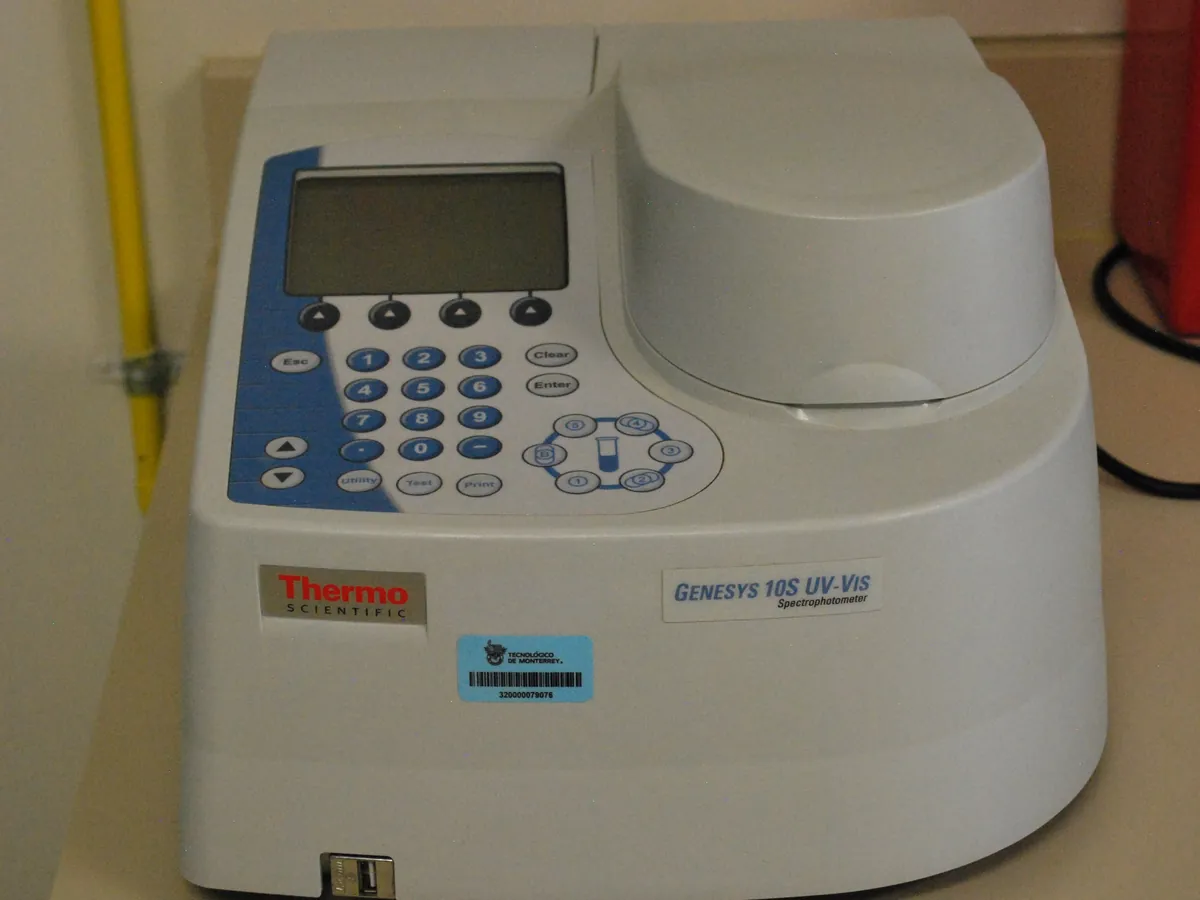
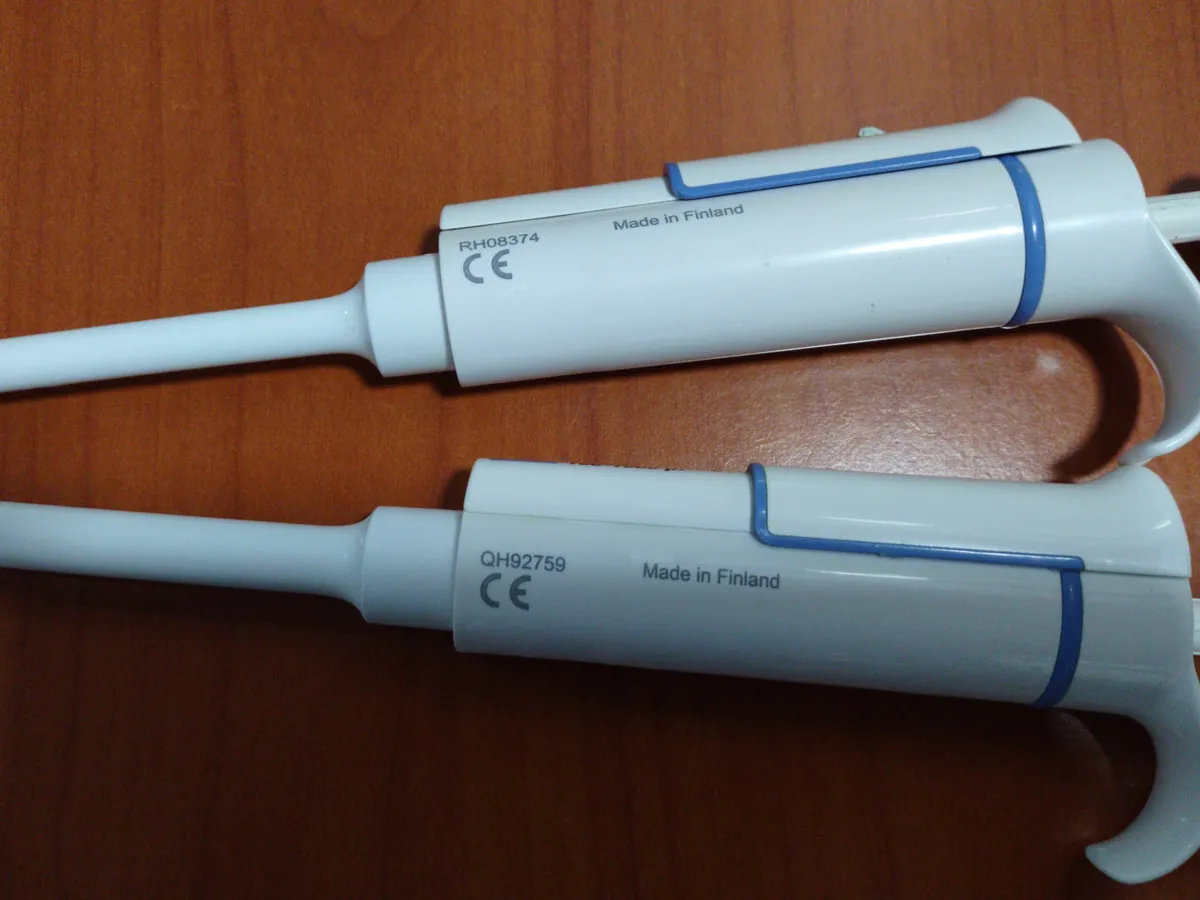
Reagents & standards
| Reagent | Grade / specification |
|---|---|
| Blank / diluent | Formulation buffer of the product (same lot used for dilution where possible) |
| Cuvette | Quartz (or UV-transparent) cuvette, 1 cm path length, matched for sample and blank |
| Extinction coefficient | Mass extinction coefficient for the product (example: 1.40 mL mg⁻¹ cm⁻¹), from the validated procedure |
Preparing the sample
- 01
Equilibrate
Bring the sample and buffer to room temperature and mix gently without foaming.
- 02
Dilute
Dilute the sample with buffer so A280 falls in the linear range (about 0.2–1.0).
- 03
Blank
Zero the spectrophotometer with buffer in the cuvette.
- 04
Measure
Read A280 and A320 of each dilution against the blank.
- 05
Calculate
Apply scatter correction, Beer–Lambert law and dilution factor.
Procedure
- 1Allow the sample and formulation buffer to reach room temperature. Mix the sample by gentle inversion; do not vortex proteins.
- 2Using a calibrated positive-displacement or air-displacement pipette suitable for viscous liquids, prepare two independent dilutions (for example 50 µL sample + 950 µL buffer = 1 in 20).
- 3Mix each dilution gently and check there are no bubbles.
- 4Blank the instrument at 280 nm and 320 nm with buffer in a clean 1 cm cuvette.
- 5Rinse the cuvette with the dilution, then fill and read A280 and A320. Read each dilution in replicate as the method states.
- 6Check that the corrected A280 is within the validated linear range; if not, adjust the dilution and repeat.
- 7Optional: record a full spectrum (240–350 nm) to check the shape (a peak near 278–280 nm and a minimum near 250 nm).
Notes for analysts
- The extinction coefficient must be specific to the product. Using a generic value of 1.0 for an unknown protein gives only an estimate.
- Excipients such as polysorbate (with peroxides), some preservatives and nucleic acids absorb near 260–280 nm and can bias results; a high A260/A280 ratio suggests nucleic acid contamination.
- Micro-volume spectrophotometers avoid dilution for concentrated samples but must be qualified for path-length accuracy.
- Variable path-length (slope) spectroscopy measures A at several path lengths and uses the slope, removing the need to dilute highly concentrated antibody formulations.
Method parameters (typical)
| Wavelengths | 280 nm (analytical), 320 nm (scatter correction) |
|---|---|
| Path length | 1 cm (or a validated variable-path or micro-volume system with its own path length) |
| Spectral bandwidth | Typically 1–2 nm |
| Blank | Formulation buffer |
| Target absorbance | About 0.2–1.0 after dilution |
| Replicates | Two independent dilutions, each read at least in duplicate |
System suitability & sequence
| Parameter | Limit |
|---|---|
| Instrument qualification | Wavelength and absorbance accuracy within calibration |
| Buffer blank | Absorbance at 280 nm of buffer against water typically low (for example ≤ 0.05) or as defined in the method |
| Dilution agreement | Results from independent dilutions typically agree within about 2% (or as validated) |
| Reference standard (if used) | Measured concentration within its assigned range |
Typical sequence
- 1Blank (buffer)
- 2Reference standard or control (if used)
- 3Sample dilution 1 (replicate reads)
- 4Sample dilution 2 (replicate reads)
- 5Blank check at end
Calculation with a worked example
Where
- A280
- Absorbance of the diluted sample at 280 nm (blank-corrected)
- A320
- Absorbance at 320 nm, used to correct for light scattering
- ε
- Mass extinction coefficient (mL mg⁻¹ cm⁻¹)
- l
- Path length (cm)
- DF
- Dilution factor (for example 1000 ÷ 50 = 20)
Given
- Dilution
- 50 µL sample + 950 µL buffer (DF = 20)
- Dilution 1: A280 / A320
- 0.724 / 0.012
- Dilution 2: A280 / A320
- 0.719 / 0.011
- ε (mass extinction coefficient)
- 1.40 mL mg⁻¹ cm⁻¹
- Path length
- 1 cm
Working
- 1Dilution 1: corrected A = 0.724 − 0.012 = 0.712; c = 0.712 ÷ (1.40 × 1) = 0.5086 mg/mL in the cuvette; × 20 = 10.17 mg/mL
- 2Dilution 2: corrected A = 0.719 − 0.011 = 0.708; c = 0.708 ÷ 1.40 × 20 = 10.11 mg/mL
- 3Mean = (10.17 + 10.11) ÷ 2 = 10.14 mg/mL; difference between dilutions = 0.6%
- 4
Check: for a 148 kDa antibody, ε = 1.40 mL mg⁻¹ cm⁻¹ corresponds to a molar coefficient of 1.40 × 148 000 = 207 200 M⁻¹ cm⁻¹
Protein concentration = 10.1 mg/mL (mean of two dilutions)
What result passes
- Report against the product specification for protein concentration (commonly the target value ± a set percentage; use the limits in your specification).
- Independent dilutions agree within the validated limit.
Validation parameters (ICH Q2(R2))
| Parameter | Typical requirement |
|---|---|
| Specificity | Formulation excipients do not absorb at 280 nm (or are blanked); spectrum shape checked |
| Linearity | Absorbance vs. concentration over about 0.2–1.0 A (r ≥ 0.999 typical) |
| Accuracy | Compared with an orthogonal method such as amino acid analysis when assigning ε |
| Precision | Repeatability and intermediate precision of dilution and reading, %RSD typically ≤ 2% |
| Robustness | Effect of dilution scheme, cuvette type and instrument |
Run this method in LimsPulse: specifications and STPs under version control, results calculated and checked against limits, and a signed Certificate of Analysis.