Total Protein by BCA or Bradford Microplate Assay
Samples and a series of protein standards react with a colour reagent in a 96-well plate. Absorbance is read on a microplate reader (562 nm for BCA, 595 nm for Bradford), a standard curve is fitted, and sample protein concentration is read from the curve and multiplied by the dilution factor.
- Biotech & biologics
- Microplate colorimetry
- Plate reader
- Micropipette
- Incubator
Reference: Typical method based on USP <1057> and Ph. Eur. 2.5.33 (Bradford and bicinchoninic acid methods), with a bovine serum albumin (BSA) or product-specific standard curve.
Why this method works
In the BCA assay, protein reduces Cu²⁺ to Cu⁺ in alkaline solution (the biuret reaction) and two molecules of bicinchoninic acid bind each Cu⁺ to form a purple complex that absorbs at 562 nm. The colour develops with time and temperature, so standards and samples must be incubated together. In the Bradford assay, Coomassie Brilliant Blue G-250 binds to proteins, mainly to arginine and other basic and aromatic residues; binding shifts the dye's absorbance maximum from about 465 nm to 595 nm. Both assays respond differently to different proteins, so the result is relative to the standard used. A standard of the same protein (or a BSA standard with a correction factor) gives the most accurate results. Absorbance is related to concentration by a standard curve, which is close to linear over a limited range for BCA and is often non-linear for Bradford.
Instruments used
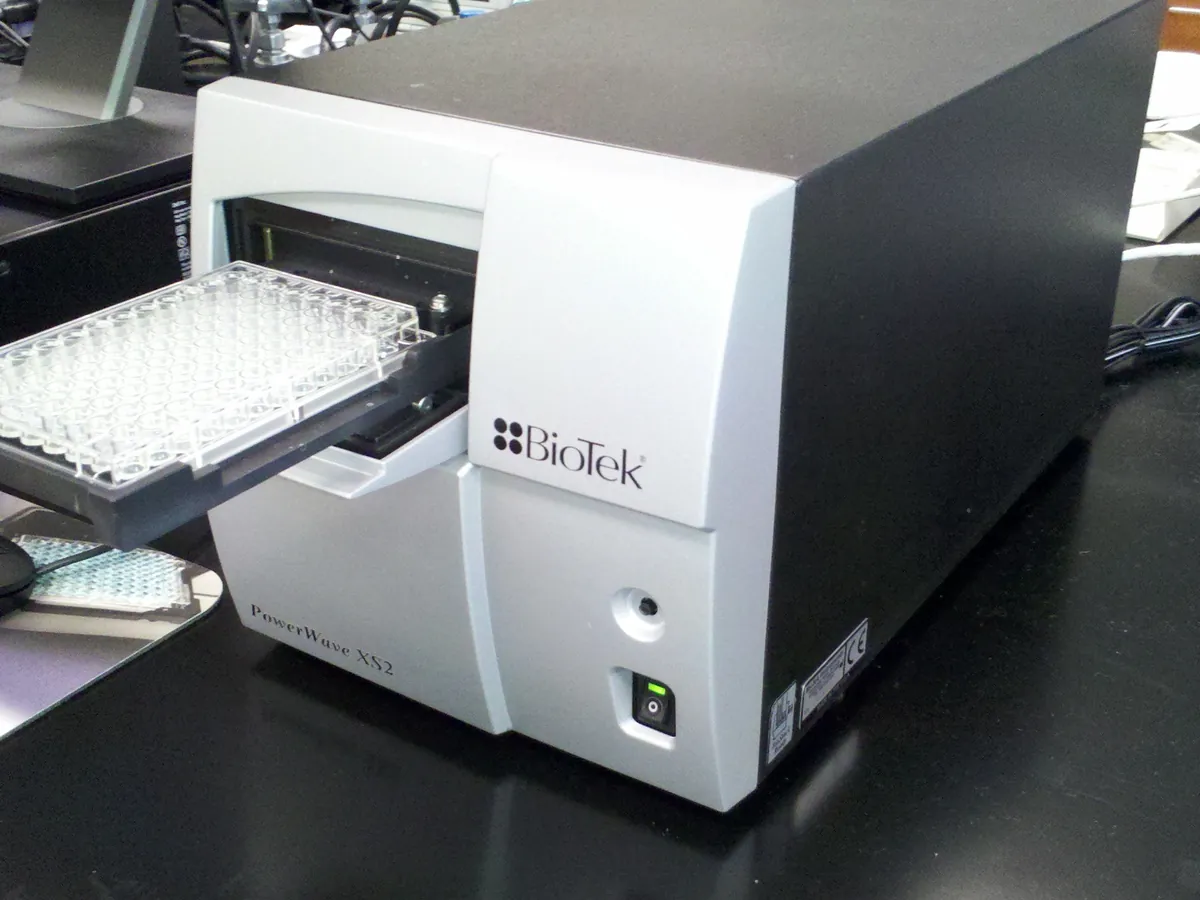
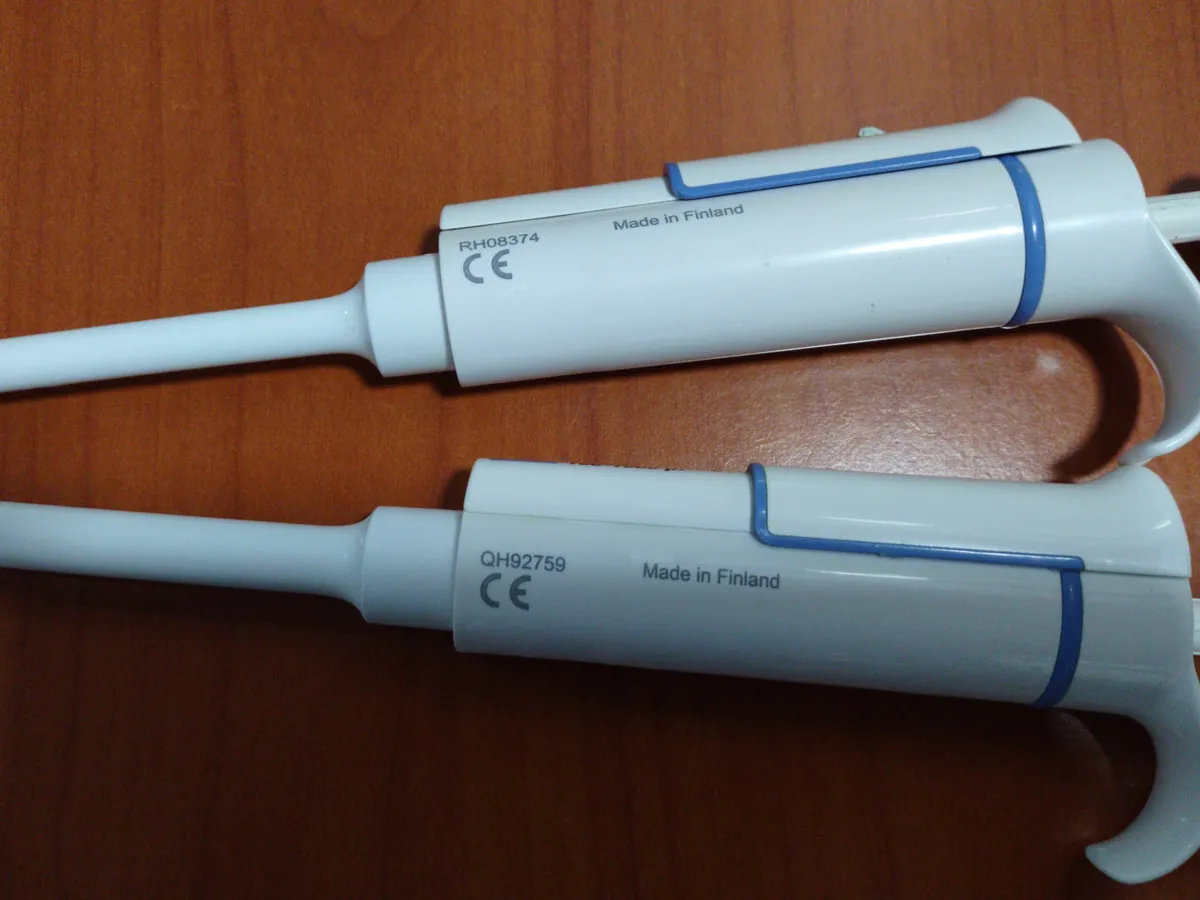
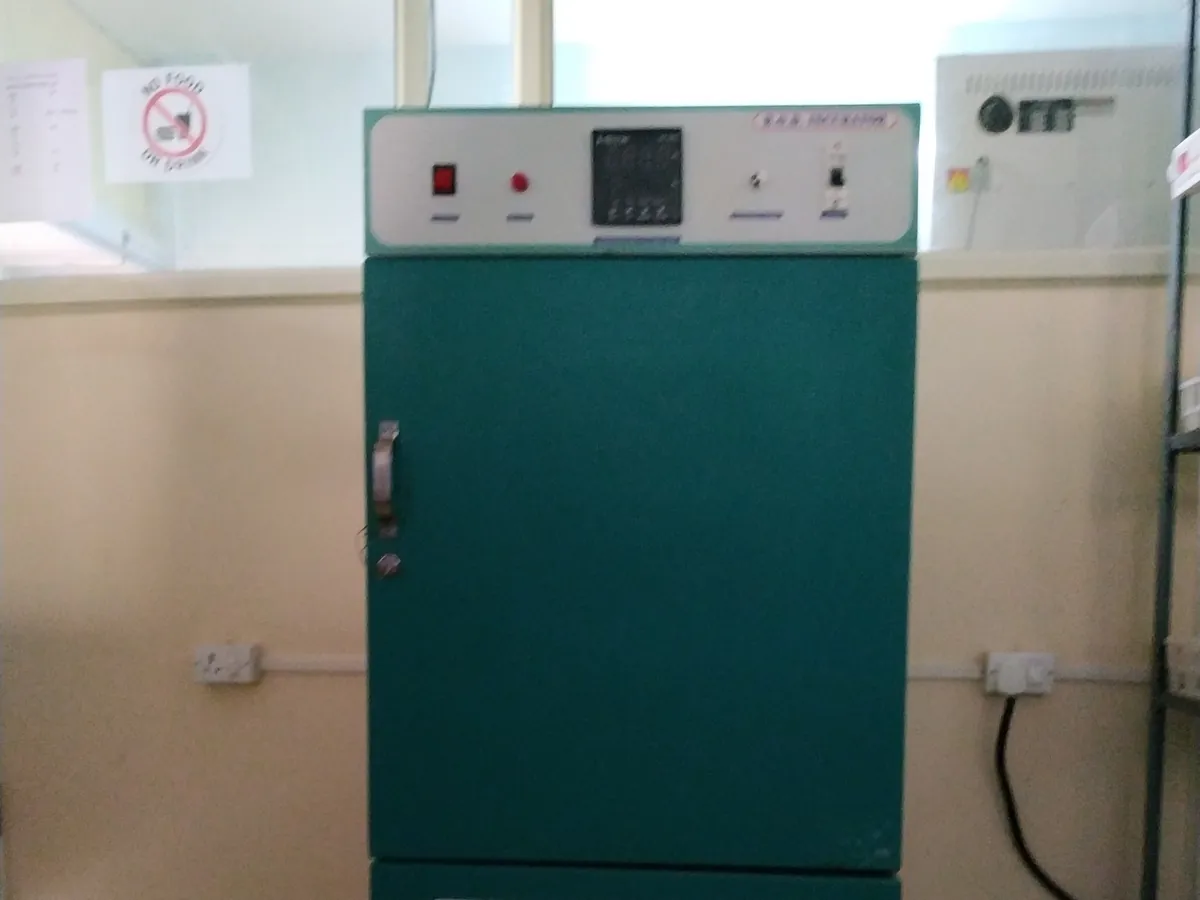
Reagents & standards
| Reagent | Grade / specification |
|---|---|
| BCA working reagent | Reagent A (BCA, sodium carbonate, sodium tartrate in alkaline buffer) mixed 50:1 with reagent B (4% copper sulphate), prepared fresh |
| Bradford reagent | Coomassie Brilliant Blue G-250 in phosphoric acid and methanol (commercial ready-to-use reagent) |
| Protein standard | BSA reference standard (for example 2 mg/mL) or the product reference standard |
| Diluent | Same buffer as the samples (formulation buffer or water as validated) |
Preparing the sample
- 01
Prepare standards
Dilute the protein standard to 5–8 levels across the working range.
- 02
Dilute samples
Dilute samples into the middle of the range with the same buffer.
- 03
Plate
Pipette blanks, standards, controls and samples into the plate in replicate.
- 04
React
Add reagent, mix and incubate (BCA: 37 °C for 30 min; Bradford: room temperature about 5–10 min).
- 05
Read
Cool if needed and read absorbance at 562 nm (BCA) or 595 nm (Bradford).
Procedure
- 1Prepare BSA standards at, for example, 0, 125, 250, 500, 750 and 1000 µg/mL in the sample buffer.
- 2Dilute each sample so its expected concentration is near the middle of the curve (for example 1 in 5). Prepare at least two independent dilutions.
- 3Pipette 25 µL of each blank, standard, control and sample dilution into the plate in duplicate or triplicate.
- 4BCA: add 200 µL of working reagent to each well, mix on a plate shaker for 30 s, cover and incubate at 37 °C for 30 min. Cool to room temperature.
- 5Bradford: add the reagent volume set in the method (for example 250 µL to 5 µL sample), mix and incubate at room temperature for about 5–10 min, reading within the stable period.
- 6Read absorbance at 562 nm (BCA) or 595 nm (Bradford). Subtract the mean blank from every well.
- 7Fit the standard curve and calculate sample concentrations.
Standard preparation
- 1Stock: BSA 2.0 mg/mL (2000 µg/mL) certified standard.
- 21000 µg/mL: 250 µL stock + 250 µL diluent.
- 3750 µg/mL: 150 µL stock + 250 µL diluent.
- 4500 µg/mL: 100 µL stock + 300 µL diluent.
- 5250 µg/mL: 100 µL of the 500 µg/mL standard + 100 µL diluent.
- 6125 µg/mL: 100 µL of the 250 µg/mL standard + 100 µL diluent.
- 70 µg/mL: diluent only (blank).
Notes for analysts
- BCA tolerates most detergents but is affected by reducing agents and copper chelators. Bradford tolerates reducing agents but is affected by detergents and strongly basic buffers.
- Different proteins give different colour yields. When BSA is used as standard, the result is 'BSA equivalent'; a product-specific standard or correction factor gives more accurate values.
- The BCA reaction keeps developing slowly after incubation, so read all plates at a consistent time after cooling.
- For Bradford, fit a non-linear (for example quadratic or 4PL) curve if the method allows, because the response flattens at higher concentration.
Method parameters (typical)
| Plate | Clear, flat-bottom 96-well plate |
|---|---|
| Wavelength | 562 nm (BCA; 540–590 nm filters acceptable if validated) or 595 nm (Bradford) |
| Sample : reagent | 25 µL : 200 µL (BCA example) |
| Incubation | BCA 37 °C, 30 min; Bradford room temperature, about 5–10 min |
| Working range | BCA about 125–1000 µg/mL (linear fit in this example); Bradford typically about 100–1000 µg/mL, often with a non-linear fit |
| Replicates | Standards and samples in duplicate or triplicate |
System suitability & sequence
| Parameter | Limit |
|---|---|
| Standard curve | r ≥ 0.99 (linear) or acceptable goodness-of-fit; back-calculated standards within about ±10–15% |
| Replicate wells | CV typically ≤ 10% |
| Control sample | Known control within its assigned range |
| Sample absorbance | Within the range of the standards |
Typical sequence
- 1Blank (0 µg/mL)
- 2Standards 125–1000 µg/mL
- 3Control sample
- 4Sample dilutions (duplicate)
- 5Plate read and blank subtraction
Calculation with a worked example
Where
- A
- Blank-corrected absorbance at 562 nm
- m
- Slope of the standard curve (absorbance per µg/mL)
- b
- Intercept of the standard curve
- c(well)
- Protein concentration of the diluted sample (µg/mL)
- DF
- Sample dilution factor
Given
- Standards (µg/mL)
- 125, 250, 500, 750, 1000
- Blank-corrected A562
- 0.118, 0.231, 0.452, 0.668, 0.880
- Sample dilution
- 1 in 5 (DF = 5), two independent dilutions
- Sample A562 (blank-corrected)
- 0.512 and 0.506
Working
- 1
Linear regression: slope m = 0.0008708 A per µg/mL, intercept b = 0.0126, r = 0.99994
- 2Dilution 1: c = (0.512 − 0.0126) ÷ 0.0008708 = 573.5 µg/mL; × 5 = 2868 µg/mL
- 3Dilution 2: c = (0.506 − 0.0126) ÷ 0.0008708 = 566.6 µg/mL; × 5 = 2833 µg/mL
- 4Mean = (2868 + 2833) ÷ 2 = 2850 µg/mL
Total protein = 2.85 mg/mL (as BSA equivalent)
Try it with your numbersWhat result passes
- Report against the specification or in-process limit for total protein; state the standard used (for example 'as BSA').
- Results of independent dilutions agree within the validated limit.
Validation parameters (ICH Q2(R2))
| Parameter | Typical requirement |
|---|---|
| Specificity / interference | Effect of buffer components tested; reducing agents, chelators (EDTA) and some sugars interfere with BCA; detergents interfere with Bradford |
| Linearity and range | Standard curve over the working range with acceptable fit |
| Accuracy | Spike recovery or comparison with A280 or amino acid analysis, typically 90–110% |
| Precision | Repeatability and intermediate precision, %RSD typically ≤ 5–10% |
| Robustness | Incubation time and temperature, reagent lot, read delay |
Run this method in LimsPulse: specifications and STPs under version control, results calculated and checked against limits, and a signed Certificate of Analysis.