Identification by UV
Supports the identity of a raw material by showing that its UV spectrum has absorption maxima (and minima) at the expected wavelengths and that its absorbance at the maximum agrees with the reference substance or with the stated specific absorbance.
- UV-Vis spectrophotometry
- UV-Vis
- Analytical balance
- Sonicator
Reference: General approach described in Ph. Eur. 2.2.25, USP <857> and USP <197>. The solvent, concentration, wavelengths and limits come from the individual monograph; always follow your approved specification and STP. The paracetamol figures here are an illustration only.
Why this method works
A substance with a chromophore absorbs UV light at characteristic wavelengths. Under fixed conditions (solvent, pH, concentration) the positions of the maxima and the absorbance per unit concentration are characteristic of the substance. UV is less specific than IR, so it is usually one of several identification tests rather than the only one.
Instruments used
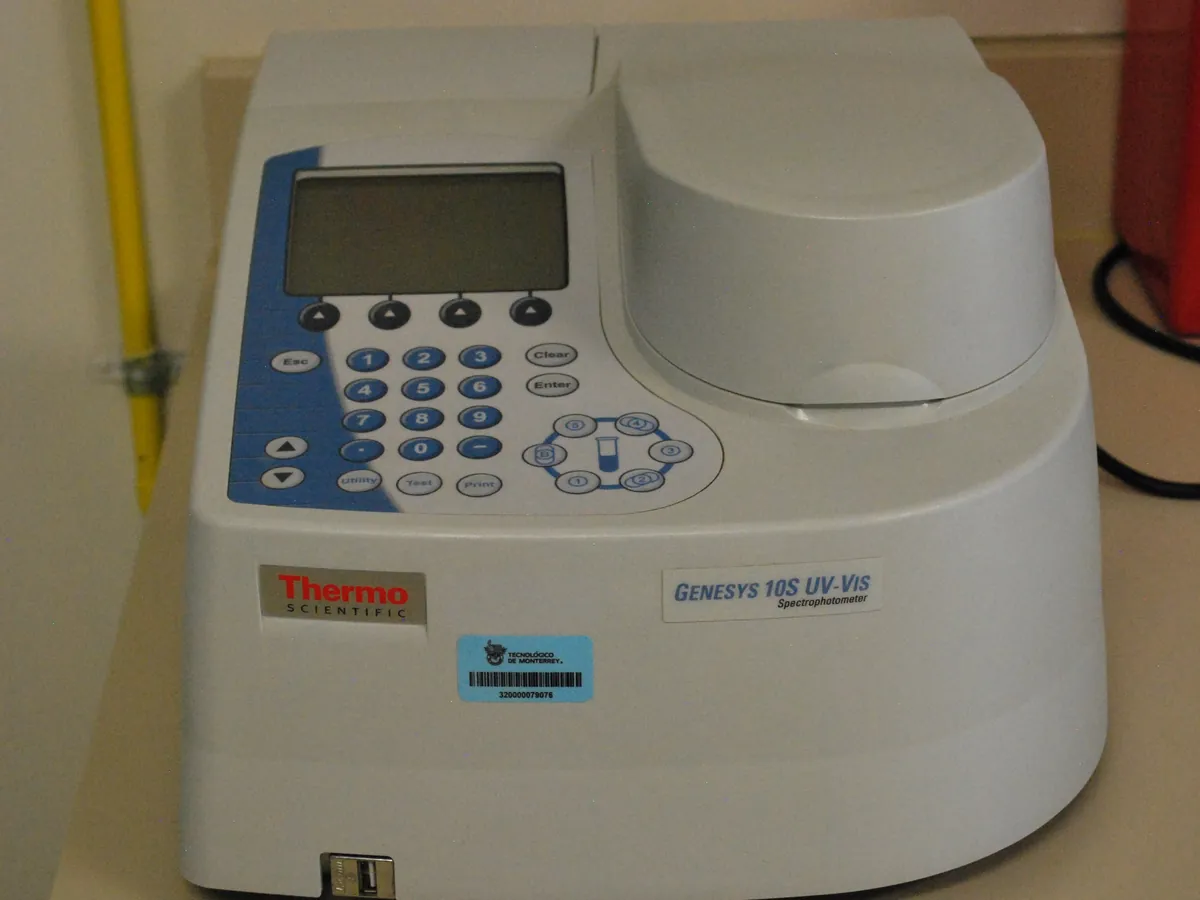
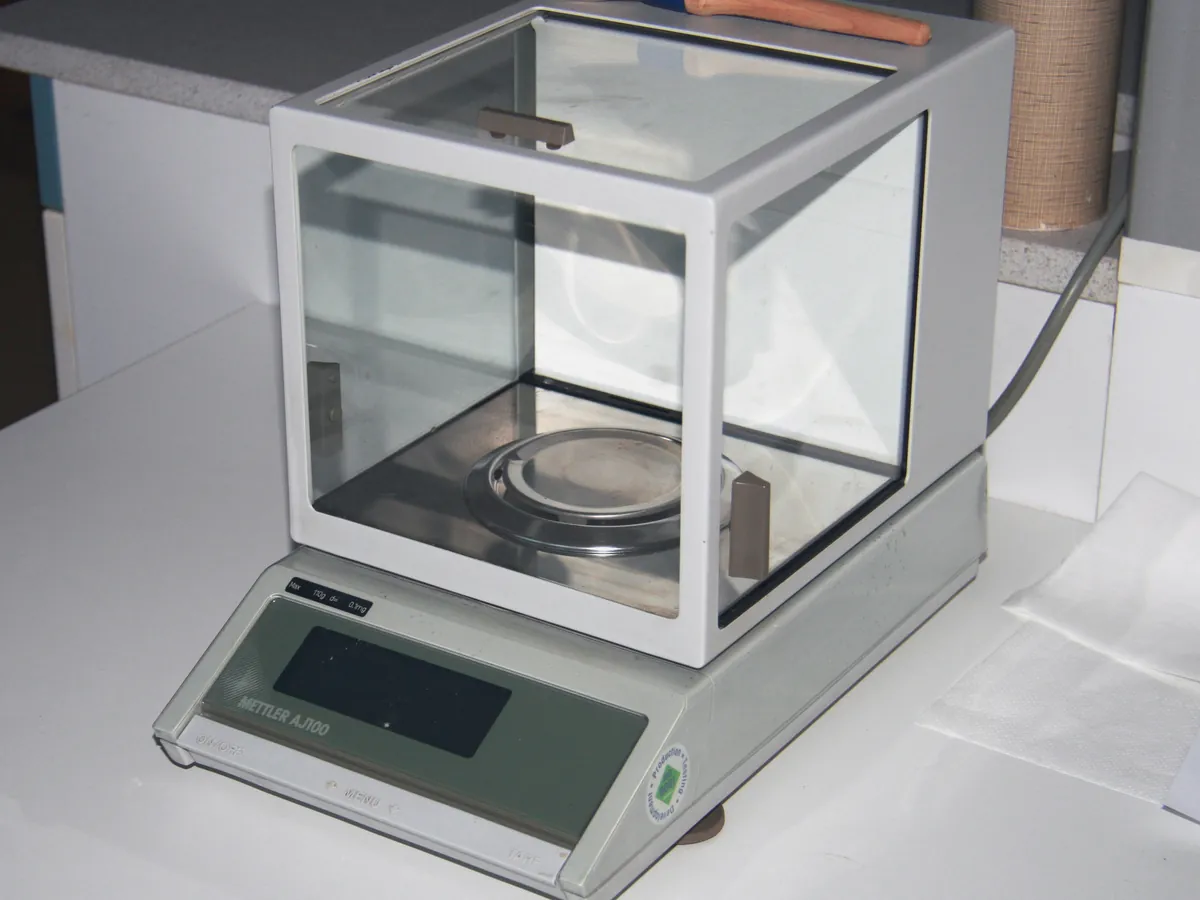
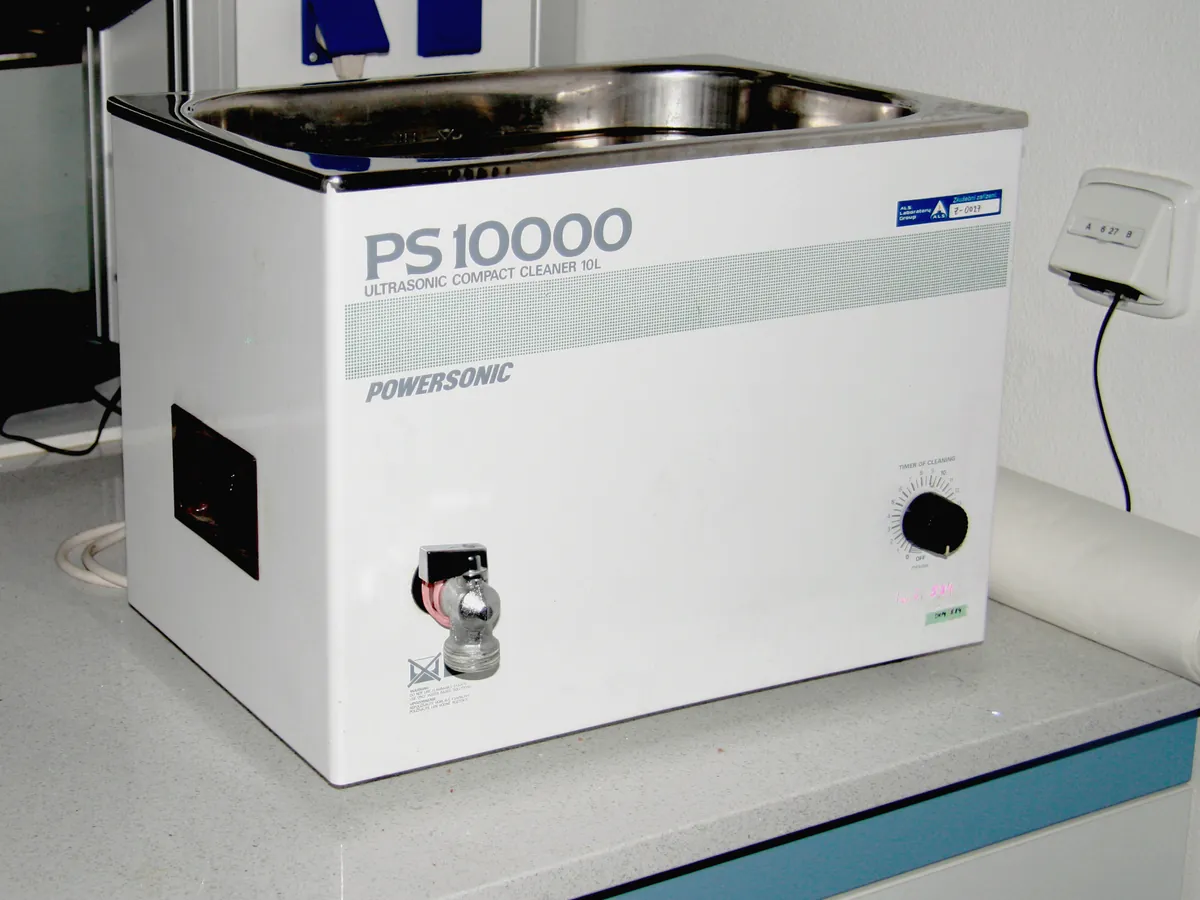
Reagents & standards
| Reagent | Grade / specification |
|---|---|
| Reference substance | Pharmacopoeial reference standard or qualified working standard (if the monograph compares with a reference) |
| Solvent | As stated in the monograph, e.g. 0.01 M sodium hydroxide for the paracetamol example, methanol or 0.1 M hydrochloric acid for others |
| Water | Purified water |
Preparing the sample
- 01
Weigh
Accurately weigh the sample (e.g. about 50 mg).
- 02
Dissolve
Dissolve in the specified solvent in a 100 mL flask; sonicate if needed.
- 03
Dilute
Dilute to the working concentration (e.g. 2 mL to 100 mL, about 10 µg/mL).
- 04
Baseline
Run a baseline with the solvent in matched quartz cells.
- 05
Scan
Record the spectrum, e.g. 220–350 nm.
- 06
Evaluate
Read λmax and absorbance; compare with the reference or specification.
Procedure
- 1Accurately weigh about 50 mg of the sample into a 100 mL volumetric flask.
- 2Add about 60 mL of the solvent (0.01 M sodium hydroxide in the paracetamol example), sonicate briefly to dissolve and make up to volume.
- 3Pipette 2.0 mL into a second 100 mL volumetric flask and make up to volume with the same solvent (about 10 µg/mL).
- 4Zero the instrument with the solvent and record the spectrum over the range stated in the monograph.
- 5Record the wavelengths of maxima and minima and the absorbance at the main maximum.
- 6If the result is to be expressed on the dried basis, use the loss on drying (or water content) value from the same batch.
Standard preparation
- 1Prepare the reference substance in the same way and at the same concentration as the sample, using the same solvent lot.
- 2Record its spectrum immediately before or after the sample under identical instrument settings.
Notes for analysts
- The position of λmax often depends on pH and solvent: paracetamol, for example, absorbs at a different wavelength in acid than in alkali. Use exactly the solvent in the monograph.
- Use quartz cuvettes for measurements below about 320 nm.
- Prepare sample and reference in the same solvent lot to avoid small baseline differences.
- Keep the absorbance in the reliable range by adjusting the dilution, but use the same dilution for sample and reference.
- The paracetamol values here illustrate the calculation; check the current monograph for the official solvent, wavelength and limits.
Method parameters (typical)
| Wavelength range | As per monograph, e.g. 220–350 nm |
|---|---|
| Expected λmax (example) | About 257 nm for paracetamol in 0.01 M sodium hydroxide |
| Cells | Matched quartz cuvettes, 10 mm path length |
| Blank | The same solvent used to prepare the solutions |
| Spectral bandwidth | As per monograph or SOP (commonly 1–2 nm) |
System suitability & sequence
| Parameter | Limit |
|---|---|
| Instrument calibration | Wavelength and absorbance accuracy within the current calibration |
| Absorbance range | Absorbance at λmax within the instrument's reliable range (typically about 0.2–1.0) |
| Baseline | Flat baseline with the solvent blank |
Typical sequence
- 1Solvent baseline
- 2Reference substance solution
- 3Sample solution
- 4Solvent check (baseline drift)
Calculation with a worked example
Where
- A
- Absorbance measured at λmax
- c
- Concentration of the solution on the dried basis, in g/100 mL
- b
- Path length in cm (1 cm)
- A(1%, 1 cm)
- Specific absorbance: absorbance of a 1 g/100 mL solution in a 1 cm cell
Given
- Sample weight
- 50.4 mg (loss on drying 0.2%) → 50.30 mg dried
- Reference weight
- 50.1 mg (loss on drying 0.1%) → 50.05 mg dried
- Dilution
- 100 mL, then 2 mL to 100 mL
- Sample absorbance at 257 nm
- 0.720
- Reference absorbance at 257 nm
- 0.716
- Path length
- 1 cm
Working
- Sample concentration = 50.30 mg/100 mL × 2/100 = 1.006 mg/100 mL = 0.001006 g/100 mL
- Sample A(1%, 1 cm) = 0.720 ÷ (0.001006 × 1) = 715.7
- Reference concentration = 50.05 mg/100 mL × 2/100 = 1.001 mg/100 mL = 0.001001 g/100 mL
- Reference A(1%, 1 cm) = 0.716 ÷ (0.001001 × 1) = 715.3
- % difference = (715.7 − 715.3) ÷ 715.3 × 100 = +0.06%
λmax of sample and reference both at 257 nm; specific absorbance agrees within 0.06% (well inside a typical ±3% limit). The sample complies with this identification test.
What result passes
- The sample spectrum shows maxima (and minima, if stated) at the same wavelengths as the reference substance, or at the wavelengths stated in the monograph, typically within ±1–2 nm or as the monograph states.
- Where a reference substance is used: the absorbances (or absorptivities) at the maximum typically agree within 3%, as described in USP <197> for UV identification; use the limit in your specification.
- Where the monograph gives a specific absorbance range at λmax, the calculated A(1%, 1 cm) lies within that range.
- Where the monograph gives an absorbance ratio between two maxima, the calculated ratio lies within the stated range.
Validation parameters (ICH Q2(R2))
| Parameter | Typical requirement |
|---|---|
| Specificity | Shown by the shape and position of the maxima; UV alone is rarely specific, so it is combined with other identification tests (e.g. IR, HPLC retention time) |
| Compendial methods | Verified under actual conditions of use (solvent lot, instrument) rather than fully validated |
Run this method in LimsPulse: specifications and STPs under version control, results calculated and checked against limits, and a signed Certificate of Analysis.