Host cell protein (HCP) by sandwich ELISA
Measures the total amount of protein from the host cell line that remains in the purified product. A polyclonal antibody mix captures many different HCPs at once; the signal is read against a standard curve of the HCP standard and reported as ng HCP per mg of product (ppm). Dilution linearity and spike recovery show the product itself does not distort the result.
- Biotech & biologics
- Sandwich ELISA (polyclonal anti-HCP antibodies, colorimetric read-out)
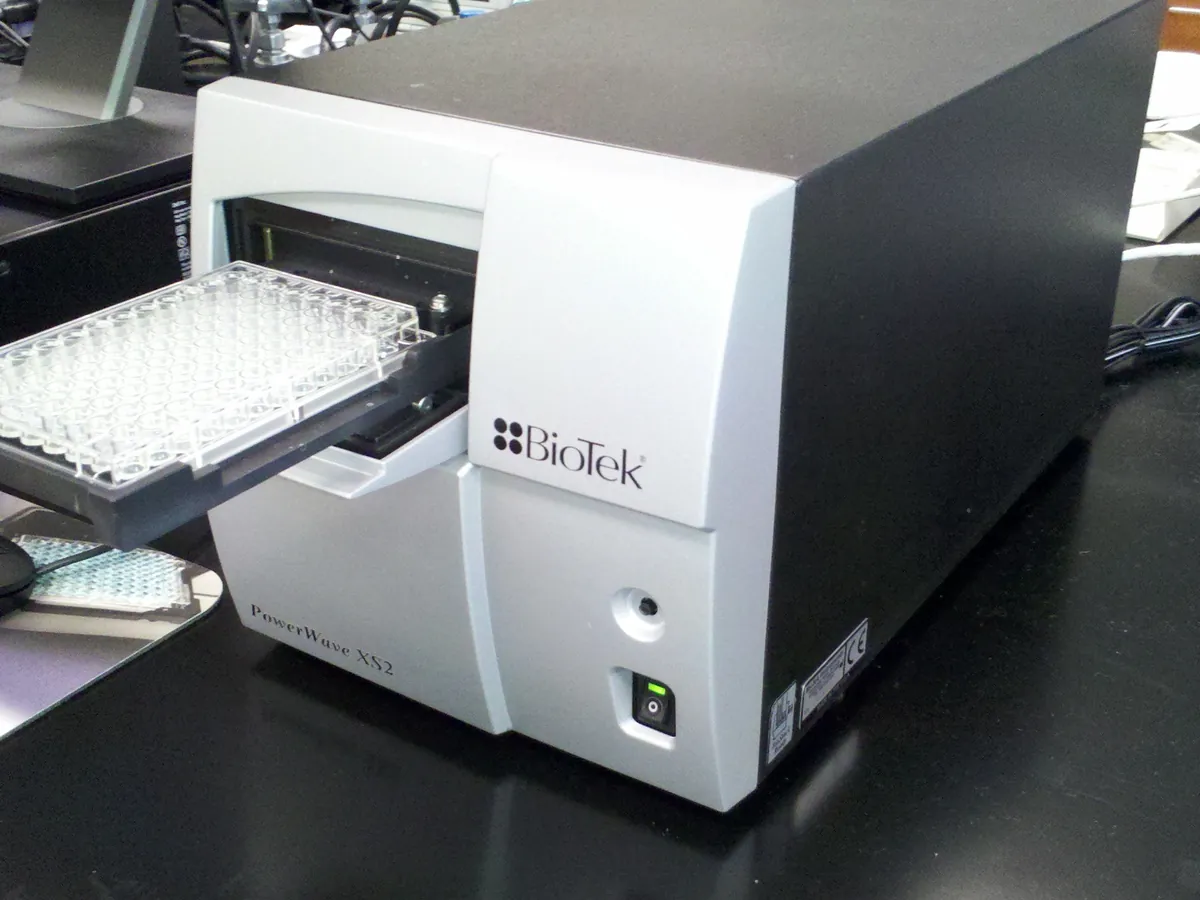
- Plate reader
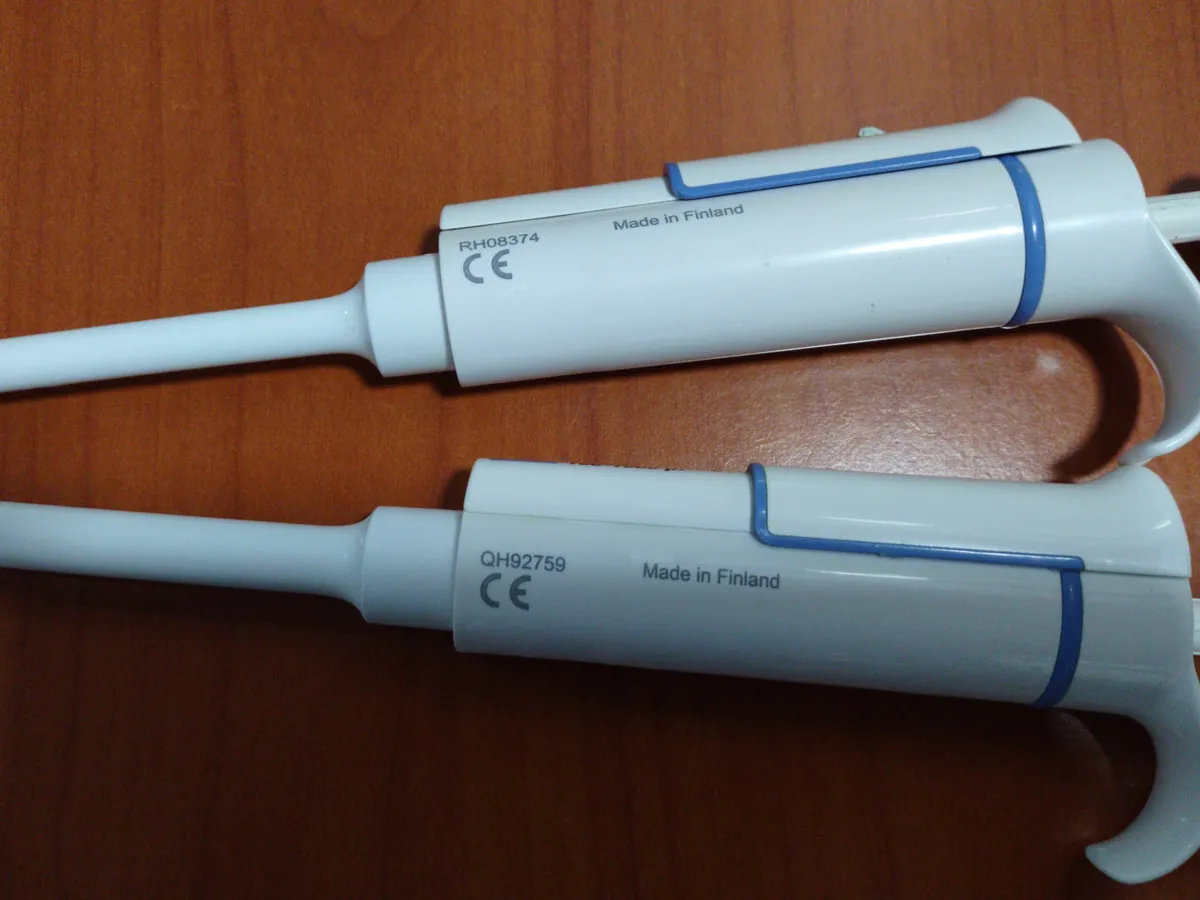
- Micropipette
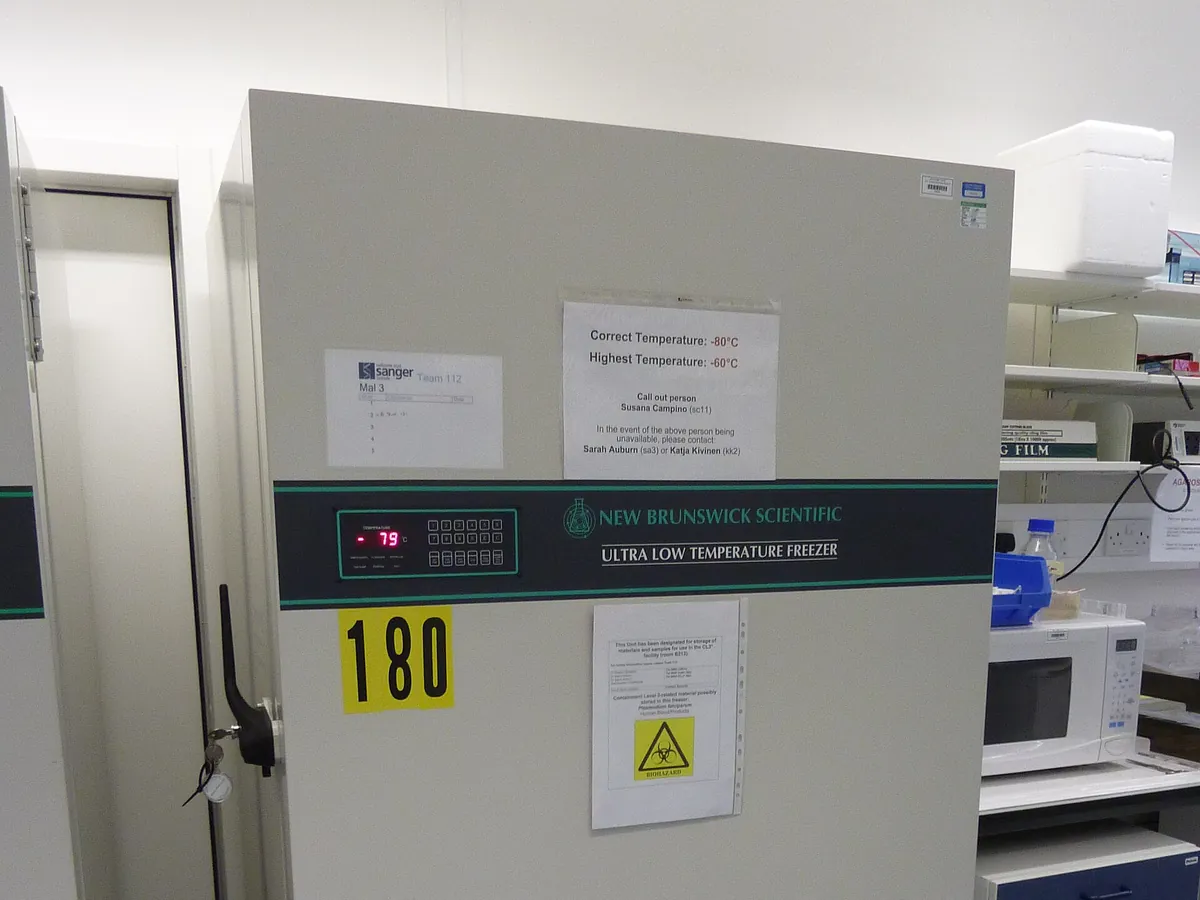
- Fridge / freezer
Reference: Typical method following the approach of USP <1132> and Ph. Eur. 2.6.34. Use the kit or in-house assay and limits in your approved procedure.
Why this method works
The plate wells are coated with polyclonal antibodies raised against the proteins of the host cell line (usually made by immunising animals with a 'null' cell culture harvest that has no product). HCPs in the sample bind to these capture antibodies. After washing, a second labelled anti-HCP antibody (for example linked to horseradish peroxidase) binds to the captured HCPs, forming a 'sandwich'. A substrate such as TMB is added; the enzyme turns it blue, the reaction is stopped with acid (turning yellow) and the absorbance at 450 nm is read. More HCP gives more colour. Because HCP is a mixture of hundreds of proteins, the result is a total HCP value relative to the HCP standard, not an exact mass of each protein. The response is not a straight line: absorbance rises slowly at low concentrations, steeply in the middle and levels off at high concentrations. The standard curve is therefore fitted with a sigmoidal four-parameter logistic (4-PL) model — described by a bottom plateau, a top plateau, the mid-point concentration and a slope factor — or a five-parameter logistic (5-PL) model, which adds an asymmetry term. Unknowns are read off the fitted curve.
Instruments used
Reagents & standards
| Reagent | Grade / specification |
|---|---|
| HCP ELISA plate | Pre-coated with anti-HCP capture antibodies (commercial generic kit or process-specific in-house assay) |
| HCP standard | Host cell protein preparation of assigned total protein content, for the standard curve |
| Detection antibody | Enzyme-labelled anti-HCP antibody (e.g. HRP conjugate) |
| Substrate and stop solution | TMB substrate; acid stop solution |
| Sample diluent | Kit diluent or validated buffer with protein blocker |
| Wash buffer | Phosphate- or Tris-buffered saline with a mild detergent |
| Controls | Low, mid and high kit controls or in-house QC samples |
Preparing the sample
- 01
Plan the plate
Lay out standards, controls, samples and spikes in duplicate or triplicate.
- 02
Dilute samples
Dilute each sample to its minimum required dilution and further dilutions.
- 03
Spike
Spike a portion of the diluted sample with HCP standard.
- 04
Incubate
Add to the plate and incubate with detection antibody; wash.
- 05
Develop
Add TMB, stop with acid and read at 450 nm.
- 06
Calculate
Fit the 4-PL/5-PL curve and back-calculate HCP.
Procedure
- 1Let kit components reach room temperature. Prepare wash buffer and the HCP standard series as the procedure directs (for example 6–8 levels plus a zero standard).
- 2Dilute the drug substance with sample diluent to at least the minimum required dilution established during validation. Prepare a series of further dilutions (for example 2- and 4-fold more) to check dilution linearity.
- 3Prepare a spiked sample by adding a known amount of HCP standard to the diluted sample, in the middle part of the standard curve.
- 4Pipette standards, controls, samples and spiked samples into the wells in replicate, add the labelled detection antibody as directed and incubate for the stated time and temperature (often with gentle shaking).
- 5Wash the wells thoroughly the stated number of times, add TMB substrate and incubate in the dark for the stated time.
- 6Add stop solution and read absorbance at 450 nm (with a reference wavelength such as 620–650 nm if specified) on the microplate reader within the stated time.
Standard preparation
- 1Prepare the HCP standard curve by serial dilution in sample diluent across the stated range, for example from a few ng/mL up to about 100 ng/mL.
- 2Include a zero standard (diluent only) to define background.
- 3Run kit or in-house controls at low, mid and high levels on every plate.
Notes for analysts
- ELISA gives total HCP relative to the standard. A few HCPs that the antibodies do not recognise, or that are very high-risk (for example certain lipases or proteases that degrade polysorbate or product), may be missed. LC-MS is increasingly used alongside ELISA to identify individual HCPs.
- Generic kits suit early development; a process-specific assay is usually expected for later-stage products.
- If results rise as the sample is diluted, product or matrix is suppressing the signal at low dilution — increase the minimum required dilution.
- Wash steps matter most: poor washing gives high background and poor precision.
Method parameters (typical)
| Format | 96-well sandwich ELISA, colorimetric (TMB) |
|---|---|
| Read-out | Absorbance at 450 nm (reference wavelength if specified) |
| Curve fit | 4-PL (or 5-PL) regression of absorbance against HCP concentration |
| Replicates | Duplicate or triplicate wells per standard and sample |
| Range | Defined by the lowest and highest standards that back-calculate acceptably (quantitation range) |
| Reporting units | ng HCP per mg product (equivalent to ppm by mass) |
System suitability & sequence
| Parameter | Limit |
|---|---|
| Standard curve fit | Back-calculated standards within the stated % of nominal (often ±20%, ±25% at the ends) |
| Controls | All controls within their assigned ranges |
| Replicate precision | %CV between replicate wells within the stated limit (often ≤ 20%) |
| Zero standard | Absorbance below the stated background limit |
Typical sequence
- 1Zero standard and HCP standard curve in replicate
- 2Low, mid and high controls
- 3Sample at three dilutions in replicate
- 4Spiked sample in replicate
Calculation with a worked example
Where
- C(curve)
- HCP concentration read from the 4-PL curve for the diluted sample (ng/mL)
- D
- Dilution factor of the sample
- P
- Protein (product) concentration of the undiluted sample (mg/mL)
- C(added)
- Concentration of HCP standard spiked into the diluted sample (ng/mL)
Given
- Product concentration P
- 10 mg/mL
- Dilution D
- 1 in 20
- C(curve), 1 in 20
- 4.2 ng/mL
- C(curve), 1 in 10 and 1 in 40
- 8.9 and 2.05 ng/mL
- Spike added
- 25 ng/mL; spiked sample read 29.6 ng/mL
Working
- 1
HCP in undiluted sample = 4.2 × 20 = 84 ng/mL
- 2
HCP = 84 ng/mL / 10 mg/mL = 8.4 ng/mg = 8.4 ppm
- 3
Dilution-corrected results: 8.9 × 10 = 89; 4.2 × 20 = 84; 2.05 × 40 = 82 ng/mL; mean 85 ng/mL; each within 96.5–104.7% of the mean (%CV 4.2%)
- 4
Spike recovery = (29.6 − 4.2) / 25 × 100 = 25.4 / 25 × 100 = 101.6%
HCP = 8.4 ng/mg (8.4 ppm); dilution linearity acceptable; spike recovery 101.6%
What result passes
- Result reported as ng/mg (ppm); not more than the product specification limit. Limits are product- and process-specific; many purified monoclonal antibodies are commonly controlled in the low ppm range (often below about 100 ppm).
- Dilution-corrected results agree across dilutions within the stated criterion (e.g. within ±20–30% of each other or of the mean).
- Spike recovery within the validated range, commonly 70–130%.
- Results below the quantitation limit are reported as less than the LOQ expressed in ng/mg.
Validation parameters (ICH Q2(R2))
| Parameter | Typical requirement |
|---|---|
| Antibody coverage | Shown by orthogonal methods (e.g. 2D gel with Western blot, or immunoaffinity capture with MS) to recognise a large proportion of the HCPs actually present |
| Specificity | Product does not interfere; minimum required dilution chosen to remove matrix effect |
| Accuracy | Spike recovery at several levels in the product matrix |
| Dilution linearity | Results consistent across serial dilutions (also shows no hook effect) |
| Precision | Repeatability and intermediate precision (plates, days, analysts, kit lots) |
| Range and LOQ | Lowest and highest standards that meet accuracy and precision |
Run this method in LimsPulse: specifications and STPs under version control, results calculated and checked against limits, and a signed Certificate of Analysis.