Stability chamber · Calibration procedure
Temperature & RH mapping
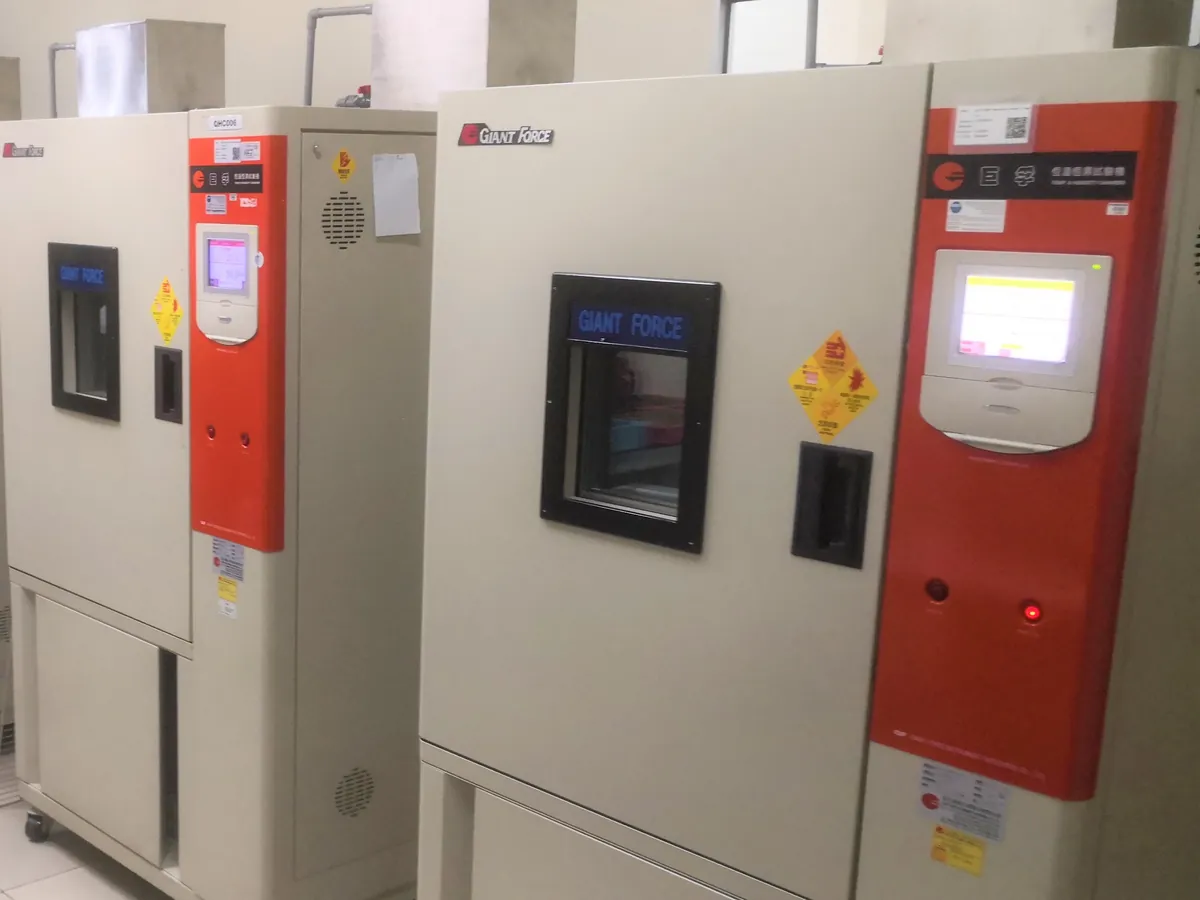
Places calibrated temperature and humidity loggers throughout the chamber to prove that every usable position stays within the ICH tolerance of the set condition.
PURPOSE
Why this is checked
The control sensor measures only one point. Mapping shows the hot, cold, wet and dry spots across all shelves, proves the whole qualified storage zone meets ±2 °C and ±5% RH (typical tolerances), and identifies the best place for the monitoring probe.
Frequency
At OQ/PQ for each set condition used (e.g. 25 °C/60% RH, 30 °C/65% RH, 40 °C/75% RH), then typically annually and after relocation, major repair or a change in loading, as defined in your SOP.
Learn how the Stability chamber worksYOU WILL NEED
Standards & tools
- Calibrated temperature/RH data loggers traceable to national standards: commonly 9 for reach-in chambers and 15 or more for larger chambers; walk-in rooms are mapped on a grid
- Validated logger software
BEFORE YOU START
Prerequisites
- Sensor calibration passed
- Approved mapping protocol defining logger positions, duration, logging interval and acceptance criteria
- Chamber stable at the set condition before the study starts
PROCEDURE
Step by step
- 1Place loggers at the corners and centre of the top, middle and bottom shelves, plus one next to the control and monitoring sensors.
- 2Set the logging interval (e.g. every 1–5 minutes) and synchronise logger clocks.
- 3Run the study for the duration in the protocol, commonly 24 to 72 hours (some sites use up to 7 days), first empty and then loaded.
- 4Carry out a door-opening test: open the door for a set time (e.g. 1 minute) and record how long conditions take to recover.
- 5Download data and find the minimum, maximum and mean temperature and RH at each logger.
- 6Identify hot/cold and wet/dry spots and record them in the report.
RECORD
Example observation table
| Logger | Position | Temp min (°C) | Temp max (°C) | RH min (%) | RH max (%) |
|---|---|---|---|---|---|
| L1 | Top front left | 39.6 | 40.5 | 73.0 | 77.1 |
| L2 | Top rear right | 39.8 | 40.7 | 72.8 | 76.9 |
| L3 | Top centre (hot spot) | 40.1 | 40.9 | 72.1 | 76.4 |
| L4 | Middle centre | 39.7 | 40.4 | 73.6 | 77.3 |
| L5 | Bottom front left (cold spot) | 39.2 | 40.1 | 74.0 | 78.3 |
| L6 | Bottom rear right | 39.4 | 40.2 | 73.8 | 78.0 |
| L7 | Next to control sensor | 39.7 | 40.3 | 73.5 | 77.0 |
CALCULATION
How to calculate the result
Deviation = Reading − Set point; Uniformity (spread) = Highest reading − Lowest reading (all loggers)
- Set condition 40 °C / 75% RH; acceptance ±2 °C and ±5% RH
- Lowest temperature 39.2 °C (L5): 39.2 − 40 = −0.8 °C. Highest 40.9 °C (L3): 40.9 − 40 = +0.9 °C
- Lowest RH 72.1% (L3): 72.1 − 75 = −2.9% RH. Highest 78.3% (L5): 78.3 − 75 = +3.3% RH
- Temperature spread = 40.9 − 39.2 = 1.7 °C; RH spread = 78.3 − 72.1 = 6.2% RH
- All readings within 38–42 °C and 70–80% RH, so the mapped zone passes
ACCEPTANCE CRITERIA
Pass if
- All loggers within the set point ± the tolerance, typically ±2 °C and ±5% RH, for the whole study.
- Recovery after a door opening within the time stated in the protocol (often 15–30 minutes).
- Any additional uniformity or stability limits as defined in your SOP.
IF IT FAILS
What to do
- Do not use the failing positions; restrict the qualified zone or move samples.
- Investigate airflow, loading, humidifier and refrigeration; get the chamber serviced.
- Assess the impact on any samples already stored and raise a deviation.
- Repeat mapping after the fix.
MORE
Other Stability chamber calibrations
In LimsPulse · Calibration Management
LimsPulse schedules this calibration, records the result against limits, and blocks the instrument everywhere if it fails or goes overdue.