Purity by GC (area normalisation)
The neat liquid is injected into a GC with an FID. Every peak is integrated, and the purity is the main peak area as a percentage of the total area of all peaks. Individual impurities are reported the same way.
- Chemicals & materials
- Gas chromatography with flame ionisation detection (GC-FID)
- GC
- Analytical balance
Reference: Typical approach used in ASTM methods for impurities in aromatic hydrocarbons (for example ASTM D2360) and in supplier specifications. Use the column, conditions and impurity list in your product specification.
Why this method works
The GC separates the sample into its components on a capillary column. The flame ionisation detector gives a response roughly proportional to the mass of carbon in each compound, so for chemically similar compounds (such as aromatic hydrocarbons) peak area % is close to mass %. Area normalisation assumes that every component elutes and is detected, and that response factors are equal. Water and inorganic material do not respond on an FID, so they are measured separately (for example water by Karl Fischer) and, if the specification requires, the area % purity is corrected for them. Where response factors differ, relative response factors or an internal standard are used instead.
Instruments used
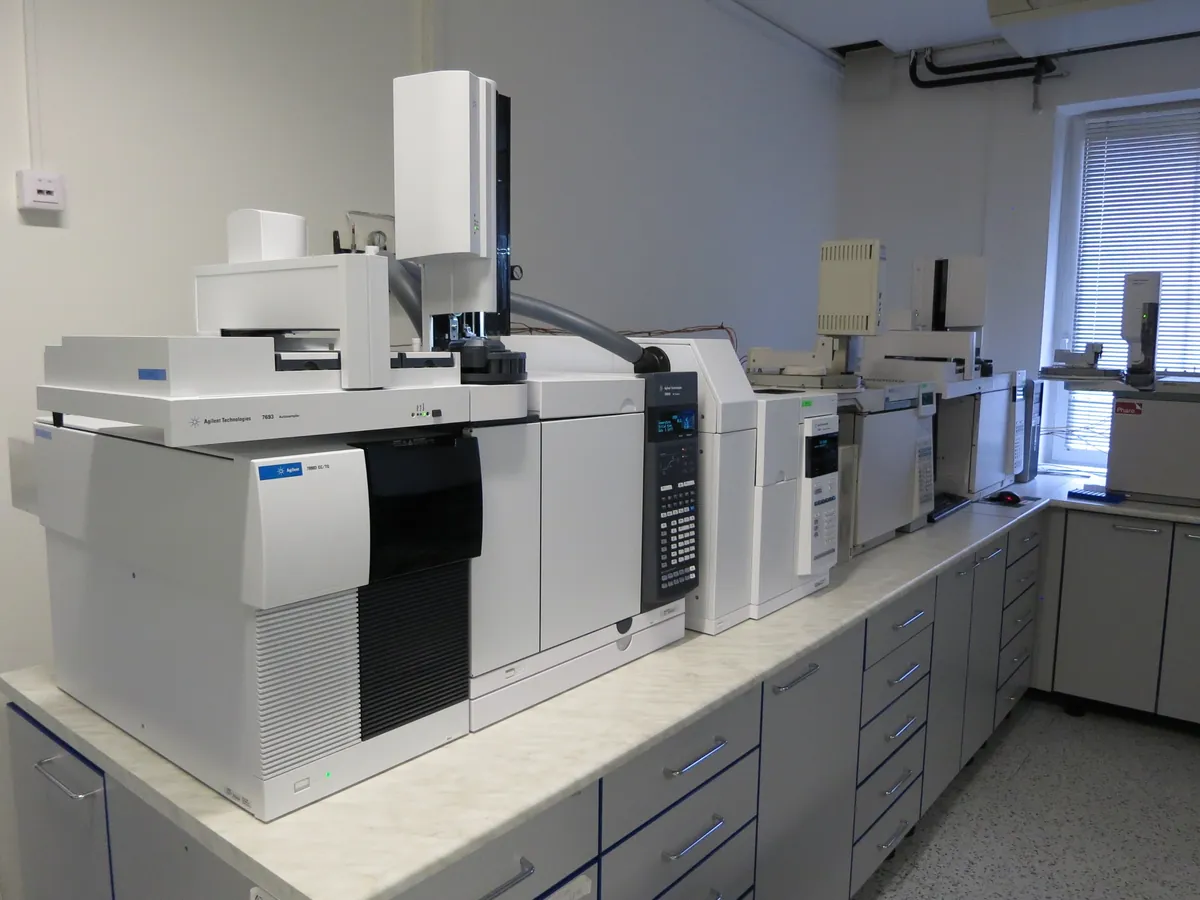
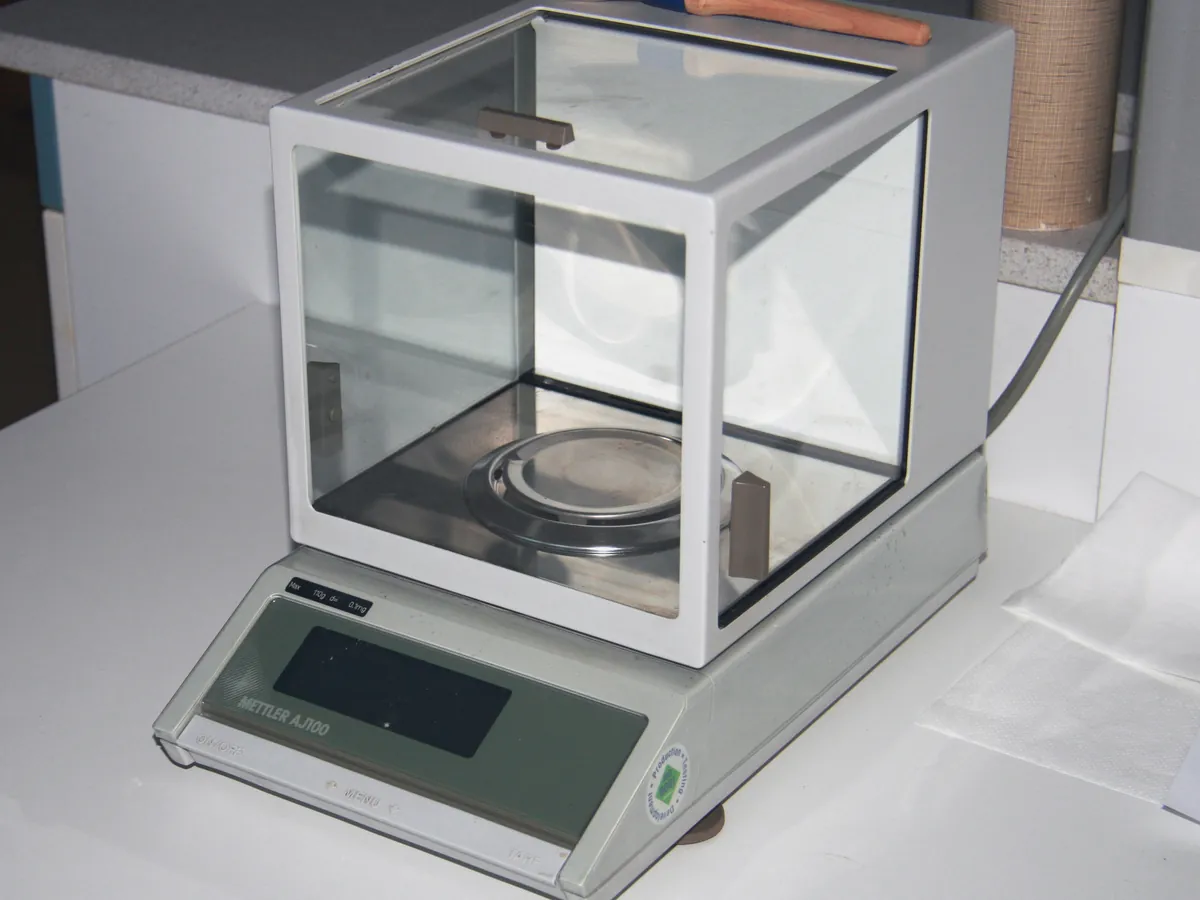
Reagents & standards
| Reagent | Grade / specification |
|---|---|
| Carrier gas | Helium or hydrogen, high purity (for example ≥ 99.999%) |
| FID gases | Hydrogen and zero air, with nitrogen make-up as the instrument requires |
| Identification mix | Main component spiked with the expected impurities (for example benzene, ethylbenzene and the xylenes in toluene) at about 0.01–0.1% each |
Preparing the sample
- 01
Sample
Take a representative sample in a clean, dry glass bottle with a PTFE-lined cap.
- 02
Transfer
Fill a GC vial directly with the neat liquid; no dilution is needed for most solvents.
- 03
Inject
Inject a small volume with a high split ratio so the main peak does not overload.
- 04
Integrate
Integrate all peaks above the disregard limit, excluding any blank peaks.
Procedure
- 1Rinse the vial with the sample, fill it about three-quarters full and cap immediately to avoid losing volatile impurities.
- 2Inject a blank (empty vial or a solvent run) to identify system peaks.
- 3Inject the identification mix to confirm retention times and check resolution.
- 4Inject the sample in duplicate.
- 5Integrate all peaks in the run time, apart from blank and air peaks, and calculate area % for each.
Standard preparation
- 1Identification mix: add known small amounts of each expected impurity to a portion of the product (or a high-purity grade) to confirm retention times.
- 2For a sensitivity check, dilute the identification mix so the smallest impurity is at about the reporting limit (for example 0.005% area).
Notes for analysts
- The chromatogram is illustrative; heights are not to scale and retention times depend on your column and conditions.
- Area % equals mass % only when response factors are similar. Oxygenated impurities (alcohols, ketones) give less FID response per gram than hydrocarbons.
- Water, dissolved gases, salts and polymeric residues are invisible to the FID; measure them separately when the specification requires a mass-balance purity.
- Check for carry-over and septum bleed peaks in the blank and exclude them from the total area.
- Do not change integration parameters sample by sample; fix them in the method and document any manual integration.
Method parameters (typical)
| Column | Polar capillary, for example polyethylene glycol (wax), 60 m × 0.32 mm, 0.5 µm film (as per method) |
|---|---|
| Carrier gas | Helium, constant flow about 1.5–2 mL/min |
| Injector | Split, about 200–250 °C, split ratio about 100:1 |
| Injection volume | About 0.5–1 µL neat |
| Oven | For example 60 °C for 10 min, then 5 °C/min to 150 °C (typical; follow your method) |
| Detector | FID at about 250 °C |
| Run time | About 15–30 min, long enough for all expected impurities to elute |
| Disregard limit | Peaks below about 0.005% area (or the limit in your specification) are not reported |
System suitability & sequence
| Parameter | Limit |
|---|---|
| Resolution | Closest critical pair (for example ethylbenzene and p-xylene) typically ≥ 1.5, or as the method states |
| Sensitivity | Smallest impurity at the reporting limit gives a signal-to-noise ratio of at least about 10 |
| Repeatability | Duplicate injections agree, for example purity within 0.02% area |
| Blank | No interfering peaks at impurity retention times |
Typical sequence
- 1Blank
- 2Identification mix
- 3Sensitivity solution
- 4Sample injection 1
- 5Sample injection 2
- 6Identification mix (bracketing, for long sequences)
Calculation with a worked example
Where
- Ai
- Peak area of component i
- ΣA
- Sum of the areas of all integrated peaks above the disregard limit (blank peaks excluded)
- A(main)
- Peak area of the main component (toluene)
Given
- Benzene
- 152
- Toluene
- 1,284,630
- Ethylbenzene
- 588
- p-Xylene
- 842
- m-Xylene
- 517
- o-Xylene
- 309
- Unknown (RT 9.4 min)
- 96
Working
- 1
ΣA = 152 + 1,284,630 + 588 + 842 + 517 + 309 + 96 = 1,287,134
- 2Toluene = 1,284,630 ÷ 1,287,134 × 100 = 99.81% area
- 3Benzene = 152 ÷ 1,287,134 × 100 = 0.012%; ethylbenzene = 0.046%; p-xylene = 0.065%; m-xylene = 0.040%; o-xylene = 0.024%; unknown = 0.0075%
- 4Total impurities = 2,504 ÷ 1,287,134 × 100 = 0.19% area (check: 99.81 + 0.19 = 100.00)
- 5
Disregard limit check: 0.005% of 1,287,134 = 64 area counts, so all peaks above are reported
Toluene purity = 99.81% area (benzene 0.012%, total impurities 0.19%)
What result passes
- Compare with the product specification, for example purity typically not less than 99.5% (area or mass %) for many commercial solvent grades, with individual limits for named impurities such as benzene.
- Report each named impurity and the largest unknown; check the specification for whether water and non-volatile residue must be subtracted.
Validation parameters (ICH Q2(R2))
| Parameter | Typical requirement |
|---|---|
| Specificity | Identification mix shows all named impurities separated from the main peak and each other |
| LOQ | Established at or below the reporting limit for impurities |
| Linearity | Impurities spiked over about LOQ to 150% of their limit |
| Precision | Repeatability of purity and of each impurity on six preparations |
| Response factors | Checked with weighed mixtures; if they differ markedly, use corrected area or internal standard calculation |
Run this method in LimsPulse: specifications and STPs under version control, results calculated and checked against limits, and a signed Certificate of Analysis.