Force and distance calibration
Verifies the load cell against traceable weights across its range and the probe travel against calibrated gauge blocks, so firmness and distance-based results can be trusted.
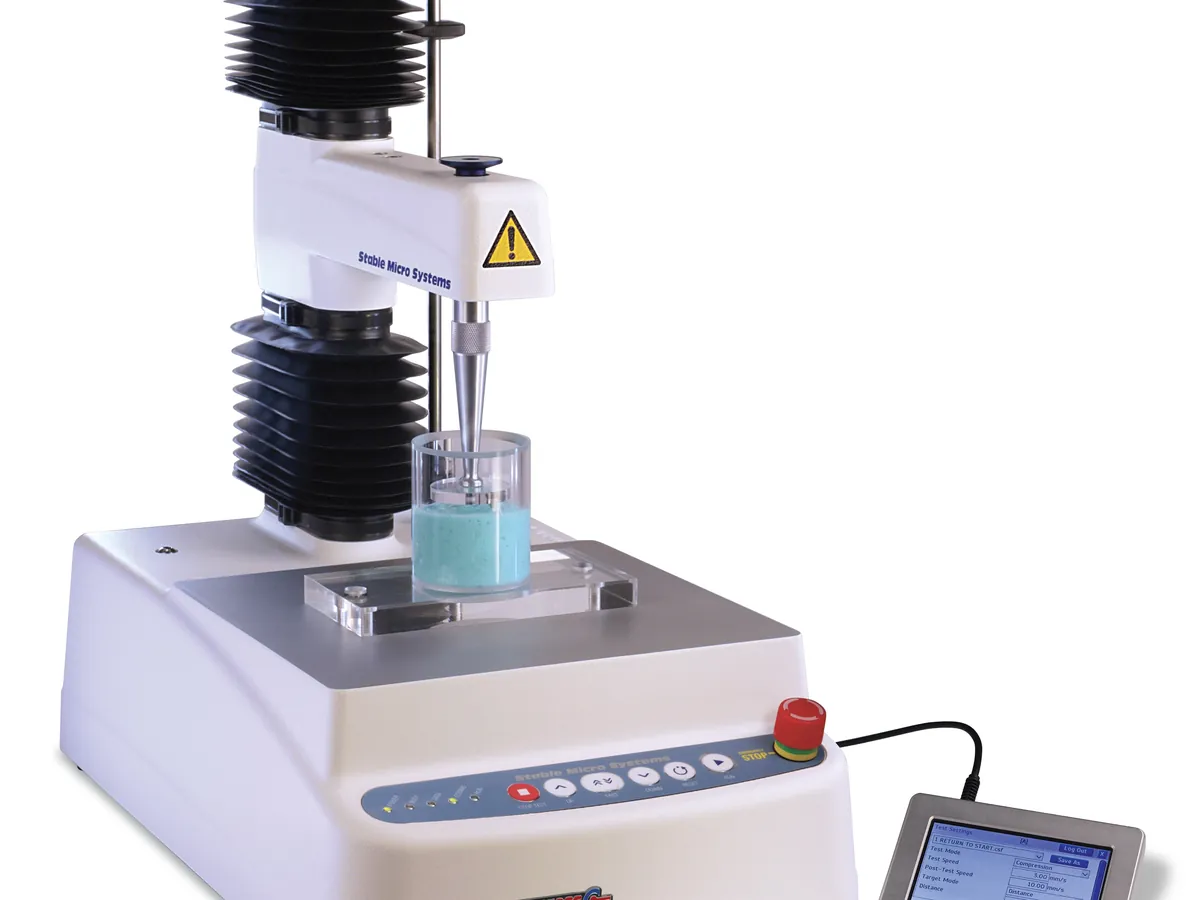
Why this is checked
Texture results are forces and areas under force–distance curves. A load cell that reads 2% high, or an arm that travels 0.2 mm further than set, shifts every firmness and work value. Daily calibration with the instrument's own weight sets the zero and span; a periodic traceable check across the range proves accuracy and linearity.
Force calibration with the supplied certified weight daily or before each session; full traceable force and distance verification typically every 6–12 months and after an overload or repair, as defined in your SOP.
Learn how the Texture analyser worksStandards & tools
- Traceable calibrated weights (for example 500 g, 1 kg, 2 kg and 5 kg for a 5 kg load cell; OIML class M1 or better)
- Calibrated gauge blocks or a height gauge (for example 5 mm and 10 mm)
- Stopwatch or the instrument's time log for speed checks
Prerequisites
- Instrument level, on a stable bench and warmed up as the manual says
- Correct load cell fitted and recognised by the software
- Weight platform or calibration pan clean
Step by step
- 1Run the daily force calibration routine with the supplied weight (zero, then span).
- 2Place each traceable weight in turn on the calibration platform and record the force reading in newtons (or grams force).
- 3Calculate the expected force: F = m × g, with g = 9.80665 m/s² (or the local value if the SOP requires).
- 4Calculate the error for each weight as a percentage of the expected force.
- 5Run the height calibration so that the probe zero is at the platform surface.
- 6Place a gauge block under a flat probe, move the probe down until the trigger force is reached and record the height displayed; repeat with a second block.
- 7Optionally time a long travel at a set speed to check speed accuracy.
- 8Record results, weight and gauge certificates and the load cell serial number.
Example observation table
| Applied | Expected | Reading | Error | Result |
|---|---|---|---|---|
| 500 g | 4.903 N | 4.893 N | −0.21% | Pass |
| 1000 g | 9.807 N | 9.818 N | +0.12% | Pass |
| 2000 g | 19.613 N | 19.580 N | −0.17% | Pass |
| 5000 g | 49.033 N | 49.120 N | +0.18% | Pass |
| Gauge block 10.00 mm | 10.00 mm | 10.02 mm | +0.02 mm | Pass |
How to calculate the result
- 1
2000 g: F = 2.000 kg × 9.80665 = 19.613 N
- 2Reading 19.580 N: error = (19.580 − 19.613) ÷ 19.613 × 100 = −0.17%
- 3
Gauge block: 10.02 − 10.00 = +0.02 mm
Pass if
- Force error typically within ± 0.5% of the applied load (or the manufacturer's specification) over the working range
- Distance error within the manufacturer's specification, often a few hundredths of a millimetre
- Speed within the specification stated by the supplier, if checked
What to do
- Stop using the load cell for reportable work.
- Repeat the daily calibration and check the probe and platform are tight and clean.
- If still out, check for overload damage and send the load cell for repair or recalibration.
- Review results generated since the last passing check.
LimsPulse schedules this calibration, records the result against limits, and blocks the instrument everywhere if it fails or goes overdue.