Temperature and CO₂ verification
Measures chamber temperature at several points and CO₂ concentration with calibrated instruments, and compares them with the incubator display and set points.
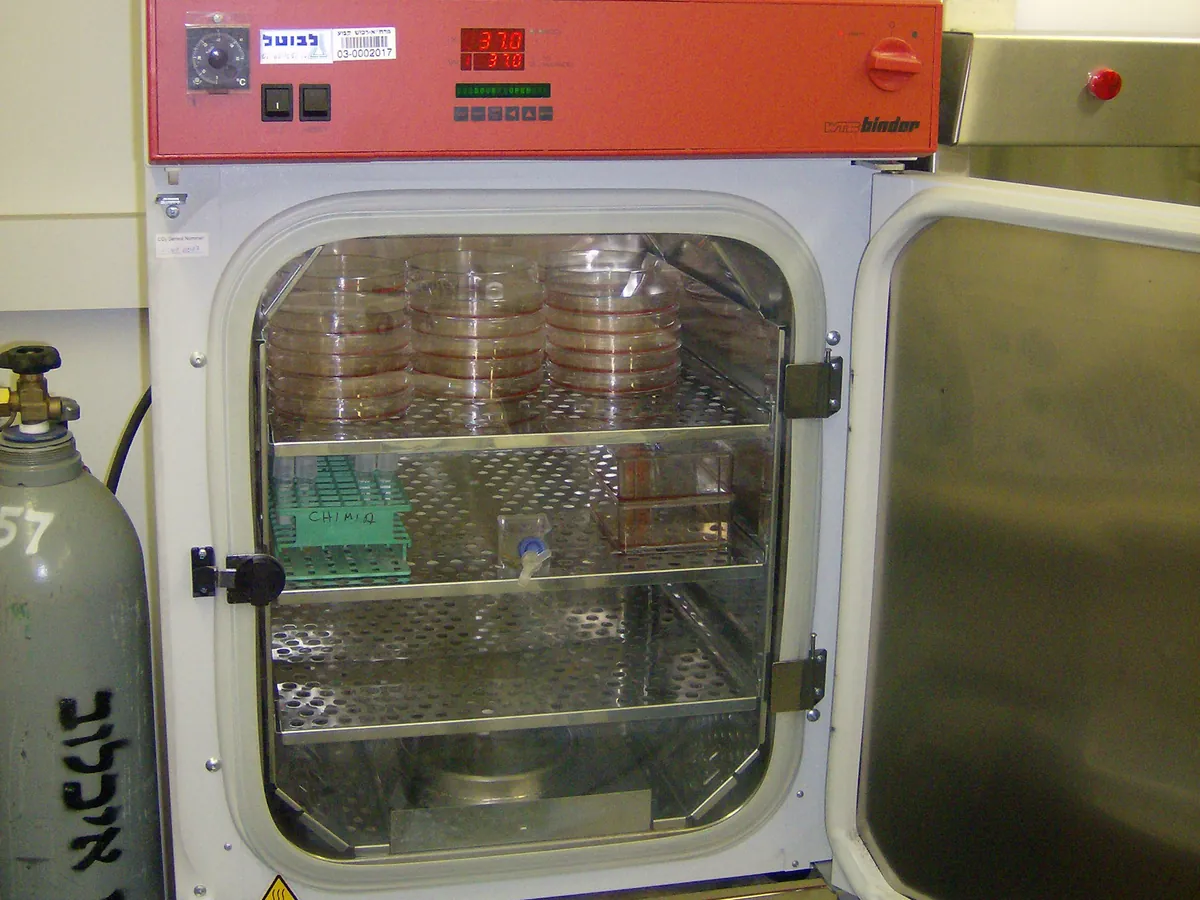
Why this is checked
Cells are sensitive to small changes in temperature and pH. A display that reads correctly but a chamber that is uneven, or a CO₂ sensor that has drifted, can change growth rates and assay results. Independent calibrated instruments confirm what the cells really experience.
Typically every 6–12 months for full mapping, with more frequent CO₂ spot checks (for example monthly) as defined in your SOP.
Learn how the CO₂ incubator worksStandards & tools
- Calibrated multi-channel temperature logger or thermocouples (typically 9 probes for an empty chamber), traceable to national standards
- Calibrated portable CO₂ analyser (IR type) with a sample tube for the incubator sample port
Prerequisites
- Incubator stable at set point (for example 37.0 °C, 5.0% CO₂) for at least the time in your SOP
- Chamber empty of cultures (or as defined for loaded studies), water pan filled
- Analyser warmed up and zeroed as the manual says
Step by step
- 1Place temperature probes at the chamber centre and near each corner on top and bottom shelves (9 points), away from walls.
- 2Route cables through the access port or door seal without leaving a gap.
- 3Close the door and let the chamber stabilise; log readings for the set period (for example 1–2 h at 1 min intervals).
- 4Record display temperature at the same times.
- 5Connect the CO₂ analyser to the sample port and take three readings, recording the display CO₂ at each.
- 6Calculate mean temperature, uniformity (max − min), display error, and CO₂ error.
Example observation table
| Measurement | Readings | Mean | Result |
|---|---|---|---|
| Temperature, 9 probes (°C) | 37.1, 36.9, 37.2, 36.8, 37.0, 37.1, 36.9, 37.0, 37.2 | 37.02 (range 0.4) | Pass |
| Display temperature (°C) | 37.0 | — | Centre probe 37.0 → error 0.0 °C |
| CO₂ analyser (%) | 5.1, 5.0, 5.2 | 5.1 | Pass |
| Display CO₂ (%) | 5.0 | — | Display − analyser = −0.1% |
How to calculate the result
- 1Mean temperature = 333.2 ÷ 9 = 37.02 °C; uniformity = 37.2 − 36.8 = 0.4 °C
- 2
Display 37.0 °C against centre probe 37.0 °C → error 0.0 °C
- 3CO₂ mean = (5.1 + 5.0 + 5.2) ÷ 3 = 5.1%; display 5.0% → error = 5.0 − 5.1 = −0.1% CO₂
Pass if
- Temperature at each probe typically within ±0.5 °C of set point (or the specification in your SOP)
- Display temperature within about ±0.5 °C of the reference probe
- CO₂ typically within about ±0.5% CO₂ (absolute) of set point and display
What to do
- Move cultures to a verified incubator if results affect them.
- Adjust the temperature or CO₂ sensor offset as per the manual, then repeat the verification.
- If uniformity fails, check door seals, fan and shelf arrangement, and call service if needed.
- Assess cultures and assays incubated since the last passing check.
LimsPulse schedules this calibration, records the result against limits, and blocks the instrument everywhere if it fails or goes overdue.